Download
1 / 36
360 likes | 455 Views
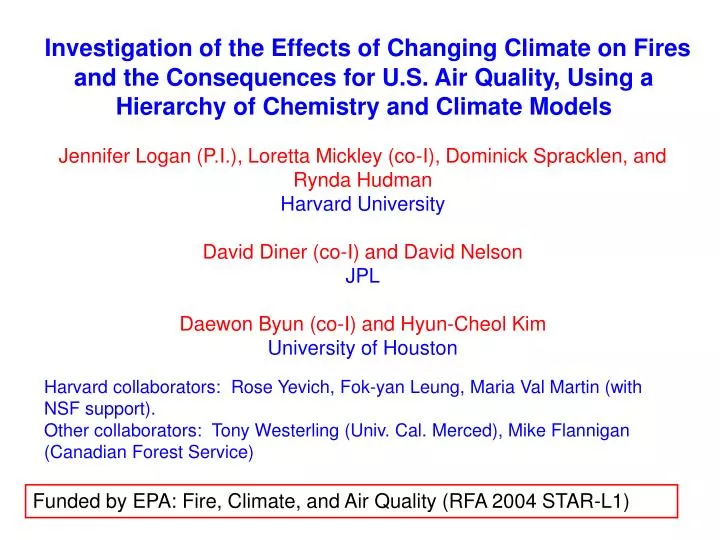
Investigation of the Effects of Changing Climate on Fires and the Consequences for U.S. Air Quality, Using a Hierarchy of Chemistry and Climate Models. Jennifer Logan (P.I.), Loretta Mickley (co-I), Dominick Spracklen, and Rynda Hudman Harvard University David Diner (co-I) and David Nelson JPL

E N D
Investigation of the Effects of Changing Climate on Fires and the Consequences for U.S. Air Quality, Using a Hierarchy of Chemistry and Climate Models Jennifer Logan (P.I.), Loretta Mickley (co-I), Dominick Spracklen, and Rynda Hudman Harvard University David Diner (co-I) and David Nelson JPL Daewon Byun (co-I) and Hyun-Cheol Kim University of Houston Harvard collaborators: Rose Yevich, Fok-yan Leung, Maria Val Martin (with NSF support). Other collaborators: Tony Westerling (Univ. Cal. Merced), Mike Flannigan (Canadian Forest Service) Funded by EPA: Fire, Climate, and Air Quality (RFA 2004 STAR-L1)
Objectives Provide an integrated assessment of the effects of fires in a future climate on ozone and PM air quality in the United States: • Explore relationship between climate and frequency/ magnitude of wildfires in N. America • Develop scenarios for future fires • Analyze plume heights from forest fires from MISR data for 2000-2004 • Quantify the dependence of air quality on height at which emissions are released • Quantify the effect of present day fires on air quality in the U.S. • Examine how different scenarios for future fires will affect air quality in a future climate • Assess uncertainty in results
Hayman fire caused worst air quality ever in Denver The Hayman fire, Colorado • 56000 ha, June 8-22, 2002 • 30 miles from Denver and Colorado Springs June 8, 2002 June 9, 2002 PM10 = 40 μg/m3 PM2.5 = 10 μg/m3 PM10 = 372 μg/m3 PM2.5 = 200 μg/m3 Colorado Department of Public Health and Environment Vedal et al., Env Res, 2006
Present day effects of wildfire emissions on ozone over the United States: a case study (Morris et al., JGR, 2006) In 2004, a blocking ridge set up over Canada and Alaska creating one of the largest fire seasons on record. In this event, ozone in Houston was the highest for the past four July months Blocking highs may last longer under a warming climate, making understanding fire behavior and air quality impacts from Canada and Alaska crucial.
Long-range transport of boreal wildfire emissions can also affect lower 48 states. http://asl.umbc.edu/pub/mcmillan/www/index_INTEXA.html
Observed increases in fires in North America Area burned in Canada has increased since the 1960s, correlated with temp. increase. 5 year means Gillett et al., 2004 Increased fire frequency over western U.S. in recent decades – related to warmer temp., earlier snow melt. Westerling et al., 2007
Where are the fires in the western U.S.? Mean area burned (1º x 1º grid) in 1980-2000 (Westerling et al., 2002) Mean fuel consumed (Spracklen et al., 2008) The Pacific North West and Rocky Mountain Forests are most important for biomass consumption and emissions. Large areas burned in CA and the southwest, but fuel burned is greater in forest than in shrub ecosystems
Can we reproduce the effects of past fires on OC in the western United States? • GEOS-Chem simulation of organic carbon from 1987-2004 • Assimilated meteorological data from NASA/Goddard GMAO • Area burned on a 1ºx1º grid (Westerling et al., 2007) • Fuel loadings from FCCS for the U.S. (McKenzie et al. 2007) • Fire severity based on analysis of large fires in 2002 • Fires outside the western U.S. were the same each year • Evaluate results with IMPROVE observations
Wildfires drive interannual variability of organic carbon in the western U.S. in summer(Spracklen et al., GRL, 2007) Model gives same variability as observed OC in summer at IMPROVE sites in the West OC contribution to total fine aerosol: 40% in low fire years 55% in high fire years same fires every year
How do we predict of fires in a future climate?Approach used by Flannigan et al. (2005) for Canada • Use a gridded data-base of area burned in the western U.S. for 24 years (Westerling et al., 2002). • Determine the relationship between area burned and meteorology (temp., RH, wind speed, precip) and fire indicators from the Canadian Fire Weather Index (FWI) model, with linear regression. • Use output from the GISS GCM for the IPCC A1B scenario to predict future meteorology • Use GISS output and regression relationships to predict future area burned
GISS GCM METEROLOGOICAL OUTPUT USED TO PROJECT FUTURE EMISSIONS AND AIR QUALITY CHANGES changing greenhouse gases (A1B scenario) GISS general circulation model 1950 2000 2025 2050 2075 2100 Spin-up Area Burned Regressions archived met fields GEOS-CHEM Global chemistry model Predict Area Burned Calculate emissions
Examples of area burned regressions for forest ecoregions Best predictors are generally temperature and fuel moisture codes R2 values highest for forested ecosystems, lowest for shrub ecosystems with this approach Spracklen et al., in review, JGR, 2008 Available at www.as.harvard.edu/chemistry/trop
Changes in meteorology over the West from1996-2005 to 2046-2055 Temperature Rel. Humidity Wind Speed Rainfall • Temp. increases 1-3ºC across West • Rainfall and RH increase slightly • Wind speed decreases slightly
Predicted area burned in forested ecosystems Note increase in area burned and in temperature, with variability Observed area burned Predicted temperature Predicted area burned Predicted area burned for 1995-2004 does not match observed areas on a yearly basis, as it is based on GCM output, but 10 year mean is the same.
Predicted biomass burned by fires in the West, 1996-2055 Results shown as the number of standard deviations away from the mean for 1996-2005.
Predicted changes in fires in the west from 1996-2005 to 2046-2055 Increases in Area Burned: Rocky Mountain Forest 175% Pacific Northwest Forest 78% California Coastal Shrub 38% (N.S.) Desert Southwest 43% Nevada Mtns/semi-desert none Increase in fuel consumption: Total in West 91%
Predicted changes in OC and BC in 50 years from fires OC (1996-2000) BC (1996-2000) Present Day Delta OC Delta BC Change in 50 years
Effect of future fires in a future climate on organic carbon and black carbon in the western U.S. Present day fires in black, 1996-2000 Future fires in red, 2046-2050 Black carbon Organic carbon OC increases by 40%, EC increases by 20%. For OC, 75% of increase is from fire emissions, 25% from higher biogenic emissions in a warmer climate.
Effect of future fires in a future climate on ozone in the western U.S. • We are doing the same type of simulations for ozone • Results for one year simulations for present day and future • Five year runs planned
Predicted total Western US NOx emissions 2045-2054 emissions are >50% larger than during 1996-2004 [Gg NO]
Predicted mean ozone increase due to fires in the West is 3-6 ppb (for 1-5 pm, July) – preliminary! Need 5 years of model simulation Effect of fires in ozone in July 2000 Ozone increases by >5 ppbv at highest concentrations 2051 * note: Changes due to climate change alone have been subtracted out [ppbv] [Hudman et al., in prep.]
Multi-angle Imaging SpectroRadiometer- MISR David Diner, Ralph Kahn, David Nelson, JPL 9 view angles at Earth surface: nadir to 70.5º forward and backward Continuous pole-to-pole coverage on orbit dayside 360-km swath 9 day coverage at equator 2 day coverage at poles Overpass around local noon time in high and mid- latitudes 275 m - 1.1 km sampling In polar orbit aboard Terra since December 1999
Cross-section of heights as a function of distance from the source Analysis of Fire Plumes: MISR INteractive eXplorer (MINX) Smoke plume over central Alaska Histogram of heights retrieved by MINX (http://www.openchannelsoftware.org)
2002 N = 480 2004 N = 690 2005 N = 980 2006 N = 463 2007 N = 580 ~3000 smoke plumes digitalized over North America http://www-misr2.jpl.nasa.gov/EPA-Plumes/
Height distribution of plumes from MISR Most plumes are at relatively low altitude at ~noon, but a few are as high as 6 km We examined the relationship to boundary layer height and stability.
2002 10–25% 2005 4–15% 2006 9–28% 2007 9–18% Distribution of (MISR heights-BL height) for smoke plumes 5-30% smoke plumes are above the boundary layer Kahn et al, [2008] Val Martin et al., in prep.
Stable Layer Boundary Layer (BL) Plume Distribution and Atmospheric Conditions Histogram of Plume Height Retrievals Atmospheric Stability Profile Most plumes above the boundary layer are in a stable layer – example shown for one large plume Leung et al., in prep.
Downscaling of GISS GCM to Regional Scale Model (MM5)Daewon Byun “GISS2MM5” Model Configuration Comparison GISS MM5 HGRID Arakawa A (scalar) and B (wind) Arakawa B VGRID Hybrid (Sigma and Pressure) Sigma PROJECTION Lat./Lon. Lambert Conformal RESOLUTION 4 x 5 degrees 108 or 36 km # of LAYERS 23 43
Surface Temperature JJA 2000 (“current year”) GISS • Averaged 1st layer temperatures for summer (Jun., Jul. & Aug.) • Note GISS and MM5 have different layer definitions • GISS layer 1 (σ : 1.0 ~ 0.971) MM5 layer 1 (σ : 1.0 ~ 0.996) MM5 108km MM5 36km
Surface Temperature JJA 2050 (“future year”) GISS • 2050 is much warmer than 2000 Regional details of changes could be different from GCM predictions MM5 108km MM5 36km
Surface Temperature difference JJA 2050 - 2000 GISS • General patterns are well inherited during downscaling, but detailed locations and intensities are re-distributed by finer resolution surface LULC and its own dynamics MM5 108km MM5 36km
Future work on effects of fires in a future climate on air quality (1) • Improve predictions of fires in shrub and grass ecosystems (CA and southwest) • include meteorology the year before, drought indices (PDSI) • rain the previous year causes more fuel to be available for the next fire season • Improve prediction of boreal fires in Canada • effect of increasing precipitation, predicted in many GCMS • several groups have difficulty obtaining good regressions in eastern Canada
Regressions for Alaska Area burned (black) and regression fit (red); fit includes observed 500 hPa geopotential height from Fairbanks Boreal Interior Cordillera R2 = 53% R2 = 57% Preliminary results for Alaska [Hudman et al., in prep.]
Canada - regressions capture variability in some regions Most GCMS predict increases in rain for high latitudes. What will be the effects on fires? Fuel moisture is crucial. Examine … Boreal Shield West R2 of regressions (17 – 62%) Taiga Plains
Future work on effects of fires in a future climate on air quality (2) • Effects of changes in lightning on fire ignition? • Potential increases in length of fire season? • Impacts of changing climate on fire severity? • Impacts of land cover changes on fuels? • Uncertainty analysis using multiple scenarios and models (GCMs) • Improve calculation of air quality effects using 2ºx2.5º GISS GCM and GEOS-Chem with nesting to 1ºx1º
Conclusions • Interannual variability in OC in summer in the western U.S. is driven by variability in fires. • Regressions of annual area burned in western U.S. capture ~50% of interannual variability. Temperature and fuel moisture are best predictors. • Using GISS GCM output, forest fire emissions of OC are predicted to double by 2045-2055 resulting in mean increases in OC of ~40%. • Ozone is likely to increase by a few ppb as a result of the increases in fires. • Further work is needed on changes in shrub ecosystems (CA and the southwest) and on changes in Canadian forest fires. • Still to come – finish ozone simulations with GEOS-Chem • CMAQ simulations at U. Houston.