Download
1 / 34
350 likes | 539 Views
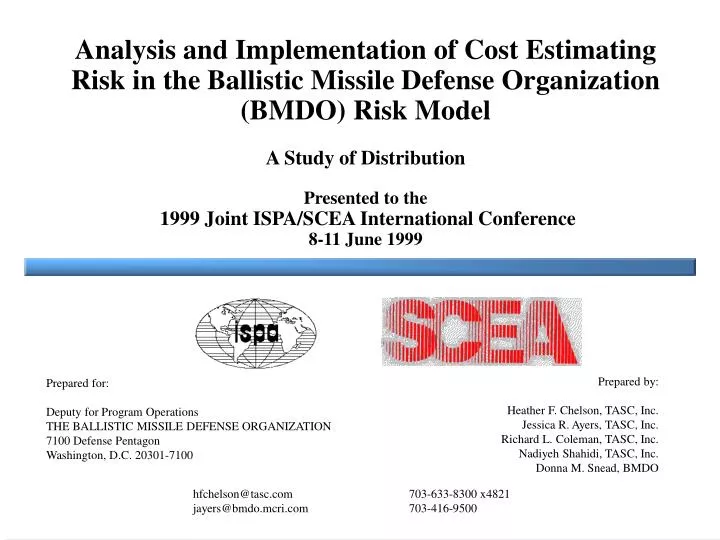
Analysis and Implementation of Cost Estimating Risk in the Ballistic Missile Defense Organization (BMDO) Risk Model A Study of Distribution Presented to the 1999 Joint ISPA/SCEA International Conference 8-11 June 1999. Prepared for: Deputy for Program Operations

E N D
Analysis and Implementation of Cost Estimating Risk in the Ballistic Missile Defense Organization (BMDO) Risk ModelA Study of DistributionPresented to the1999 Joint ISPA/SCEA International Conference8-11 June 1999 Prepared for: Deputy for Program Operations THE BALLISTIC MISSILE DEFENSE ORGANIZATION 7100 Defense Pentagon Washington, D.C. 20301-7100 Prepared by: Heather F. Chelson, TASC, Inc. Jessica R. Ayers, TASC, Inc. Richard L. Coleman, TASC, Inc. Nadiyeh Shahidi, TASC, Inc. Donna M. Snead, BMDO hfchelson@tasc.com 703-633-8300 x4821 jayers@bmdo.mcri.com 703-416-9500
Outline • Risk Definitions • Purpose • Approach • New SAR Database • Analysis • First, Second, and Third Moments • Distribution • Correlation • Comparison to previous study • Moments and Distribution • Interpretation of Bias • Conclusion
Risk Definitions • Cost Growth = Cost Estimating Growth + Sked/Tech Growth + Requirements Growth + Threat Growth • Cost Risk = Cost Estimating Risk + Sked/Technical Risk + Requirements Risk + Threat Risk • Cost Estimating Risk: Risk due to cost estimating errors, and the statistical uncertainty in the estimate • Schedule/Technical Risk: Risk due to inability to conquer problems posed by the intended design in the current CARD • Requirements Risk: Risk due to as-yet-unseen design shift from the current CARD arising due to CARD shortfalls • Risk arising due to the inability of the intended design to perform the (unchanged) intended mission • “Not understanding the solution” • Threat Risk: Due to as-yet-unrevealed threat shift from the current STAR • “Not understanding the problem”
Example Cost Estimate with Risk 23% 20% 150 3% S/T Risk 100 $ CE Risk 50 Init Pt Est 0 Initial Point Add Cost Add Estimate Estimating Sched/Tech Risk Risk
Purpose • To review the Cost Estimating (CE) risk component of BMDO’s Cost Risk Methodology • The BMDO risk model currently performs risk estimation for 12 major BMDO elements including, e.g., PAC-3, THAAD, Navy Theater-Wide TBMD, and elements of the National Missile Defense Program • To gain insight into CE Risk • Large dollars (1/7th of total risk), but small insight • CE risk is one element of BMDO’s total cost risk. The current model uses • CE risk ~ 3.4% • Schedule/technical risk ~ 20% • This results in a total risk of ~ 23%.1 Each of these factors is passed through the model with functional correlation.2 • 1 Distribution and Correlation of Sources of Cost Risk, G.E. Hartigan, J.R. Ayers, and R.L. Coleman, May 15 1997. • 2 An Overview of Correlation and Functional Dependencies in Cost Risk and Uncertainty Analysis, R. L. Coleman, S. S. Gupta, DoDCAS 1994, and Cost Risk Estimates • Incorporating Functional Correlation, Acquisition Phase Relationships, and Realized Risk, by R.L. Coleman, S.S. Gupta, J.R. Ayers, and G.E. Hartigan, May 15 1997
Approach • Update to the previous analysis1 of BMDO’s Cost Estimating risk. To review: • Found that CE and S/T risk were uncorrelated • Internal variance, a proxy for CE risk was normally distributed • Update the model with new findings • Current model reflects the above research: Cost Estimating Risk 3.4% mean, 14.6% St Dev CE Risk is Normally distributed CE Risk is constant by phase CE Risk is computed once, and passed forward using Functional Correlation • Create new SAR database: increase size and stratification 1 Distribution and Correlation of Sources of Cost Risk, 15 May 1997, by Hartigan, Ayers and Coleman
New SAR Database • Database: Ayers and Chelson created a data set from a recently compiled OUSD database containing annual Selected Acquisition Reports (SARs) reported through June 1998. • The programs chosen for the study, out of the hundreds available, were narrowed down: • All programs active in 1997 • All programs were over 2 years in maturity • Eliminated programs with classified financial data • Eliminated programs with inconsistent SARs (i.e., re-baselined programs) • Eliminated programs without a summary-level variance analysis
By Service: Army -- 13 Navy -- 17 AF -- 12 DOD -- 2 By Platform: Aircraft -- 8 Combat Vehicle -- 4 Electronic -- 11 Missile -- 8 Munitions -- 2 Ship -- 7 Space -- 4 By Estimate Type: Planning -- 20 Development -- 32 Production -- 19 (many programs spanned more than one milestone period) 435 individual SAR reports representing 44 programs dating back to 1982. New SAR Database
New SAR Database • Programs categorized into six groups: RDT&E Procurement Planning (PE) X Development (DE) X X Production (PdE) X The PE--Procurement and PdE--RDT&E lacked sufficient data points for analysis.
New SAR Database • Database construction: • Program Name, Service, Platform, Estimate Type, Base Year & Year of SAR • Breakdown for each SAR’s Estimating Variance: • To categorize among the “estimating” sub-classifications, used the explanations in the “Variance Analysis” section of each SAR. • For each program, pulled out Strict CE from all SARs (typically one per year), then summed to get the cumulative Strict CE Variance. • All cost elements converted to FY88 dollars
Analysis • Remaining Strict (pure) CE error analyzed. • Computed first, second, and third moments • Mean • Standard deviation • Skewness • Performed tests for Distribution • Kolmogorov-Smirnov (K-S) type distribution test for normality • Performed tests for Correlation • Parametric-Pearson’s • Nonparametric-Spearman’s
Results--Total and Strict CE PE DE DE Prod Total CE RDT&E RDT&E Proc Proc Mean 15.4% 22.3% 15.0% 6.0% Std Dev 36.9% 39.2% 89.6% 8.3% CV 2.4 1.8 6.0 1.4 Strict CE: Lower Means Smaller Standard Deviations Decreased Skewness Skewness 3.123 2.693 5.169 1.289 Kolmogorov- 0.265 0.260 0.450 0.242 Smirnov FAIL FAIL FAIL FAIL By phase: DE--RDT&E and DE--Procurement were not correlated.
Results--Means Corrected means stepped down a simple average of 8.7 percentage points (58.7% decrease)
Results--Weighted Average Weighted Average of Means RDT&E Procurement 7.0% PE 10.7% 3.3% DE 3.0% PdE Weighted Avg 8.7% 3.2% by Phase BMDO Model currently uses 3.4% Cost Weight Factor 1 5 Total Weighted 4.1% Avg
Interpretation--Weighted Mean • Means for RDT&E and Procurement were numerically different • RDT&E 8.7% • Procurement 3.2% • Grand weighted mean 4.1% Current CE factor 3.4% • Means for RDT&E and Procurement did not test as statistically significantly different • But, it is intuitively attractive that earlier errors have a larger bias • RDT&E mean is larger than Procurement mean • Omissions by cost estimators more likely early on
Kolmogorov-Smirnov Test Statistic Example: Cumulative CE Ratio Distribution DE Procurement Max Distance = .1094
Tests for Normality (K-S) PASS PASS PASS FAIL
Results--Distribution • Passed K-S Test for Normality: • PE RDT&E • DE RDT&E • DE Procurement • Failed K-S Test for Normality: • PdE Procurement • The Normal distribution is a good approximation for all CE Risk • No particular reason to believe that PdE Procurement errors are non-normal • PdE errors are fairly symmetric Possible Type I Error
Results--Correlation for Strict CE • Correlation: None • Note: only where it could be tested, between DE -- RDT&E and DE -- Procurement • Currently the BMDO model passes CE risk between phases using Phase-to-phase functional correlation • Sked/Tech Risk needs to be correlated for computational simplicity, accuracy and fidelity reasons • CE Risk is correlated for computational simplicity only. There are no adverse effects. • The Phase-to-phase functional correlation in CE will likely be left for simplicity • Some computational difficulties will be introduced if different means are used by phase, but this is not insurmountable
Comparison of Moments The new DE total mean is comparable to the old mean. But, the component means are different. All the standard deviations are comparable. The skewness picture is quite different. Conclusion: First and second moments are similar
Comparison of Distribution Old Data New Data N = 32 N = 21 Total of DE--RDT&E and DE--Proc N = 32 Conclusion: Data distributions are similar
Interpretation--Bias • It was formerly thought that CE Error would prove to be unbiased • CERs have no inherent bias • 3.4% is arguably indistinguishable from 0.0% • Slight negative skewness • Contradiction in mean and skewness suggested zero bias • This study strongly suggests CE Risk is biased upward • Independent data • Same average overall as before • Coherent in sub stratification -- bias and skewness consistent • Positive skewness reinforces positive bias • We conclude that positive bias is demonstrated • Perhaps this results from omissions in the initial estimate rather than a tendency for CERs to be biased • In any event, biased it is!
Interpretation--Bias • It was formerly thought that CE Error would prove to be unbiased • CERs have no inherent bias • 3.4% is arguably indistinguishable from 0.0% • Slight negative skewness • Contradiction in mean and skewness suggested zero bias • This study strongly suggests CE Risk is biased upward • Data independently constructed • Seven additional years of data. This dataset done in 1998 v. 1991. • 24% (5 out of 21) programs repeated from the previous study to the current study. • Same average overall as before • Coherent in sub stratification -- bias and skewness consistent • Positive skewness reinforces positive bias • We conclude that positive bias is demonstrated • Perhaps this results from omissions in the initial estimate rather than a tendency for CERs to be biased • In any event, biased it is!
Conclusions • First, second, and third moments examined • Gained insight into CE Risk by phase and maturity • First and second moments reinforced • Positive bias is strongly suggested • Normal distribution is a reasonable model • Data skewness is tolerable • Current treatment of CE in the BMDO model justified • Weighted average analysis yielded ~ 4% • Opportunity for differences by phase if desired • Cost Estimating Risk is now as well understood as Sked/Tech Risk • Rigor and accuracy are increased • Underlying philosophy is unchanged
Spearman’s Pearson’s Correlation--RDT&E and Procurement