Download
1 / 40
400 likes | 604 Views
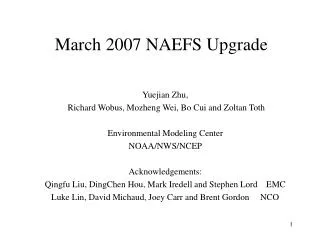
May 2006 Upgrade of the GEFS and First Implementation of NAEFS systems. Yuejian Zhu, Zoltan Toth, Richard Wobus, Mozheng Wei and Bo Cui Environmental Modeling Center NOAA/NWS/NCEP Acknowledgements: DingChen Hou, Ken Campana, Mark Iredell and Stephen Lord EMC

E N D
May 2006 Upgrade of the GEFS and First Implementation of NAEFS systems Yuejian Zhu, Zoltan Toth, Richard Wobus, Mozheng Wei and Bo Cui Environmental Modeling Center NOAA/NWS/NCEP Acknowledgements: DingChen Hou, Ken Campana, Mark Iredell and Stephen Lord EMC David Michaud, Brent Gordon and Luke Lin NCO
NAEFS Background Information • First of a kind project • Operational multi-center ensemble system • Bias correction, climate percentiles never computed on such a scale operationally • Timetable • Mar 2003 Project started • Oct 2003 Draft Research, Development and Implementation Plan • Sep 2004 Initial Operational Capability – Operational data exchange • May 2006 First Operational Implementation • Challenges • Developed joint plan with MSC personnel • Arranged operational data exchange • Coordinated GEFS development with international NAEFS developments • Coordinated software development & operational implementation with MSC • Worked with less THORPEX resources than planned originally • Future expansion • Develop sustainable plans • Coordinate with partners • Rename NAEFS and position it as prototype GIFS system • Resource concerns • Computational (telecommunication, disc, etc) • Human
Planned Changes for GEFS- Summary • Increase the number of perturbed ensemble members • 14 (in place of current 10) perturbed runs for each cycle (20 by early 2007) • NAEFS requirement • This change is intended to improve ensemble based prob. forecasts • Results: improved probabilistic skill, slightly improved ensemble mean skill (seasonally dependent) • Add control runs for 06, 12 and 18Z cycles • This change is intended to enable for relocation of perturbed tropical storm • Facilitates comparison of high & lower resolution ensemble controls • If lores control and ensemble mean differ – indication of nonlinearities • If high & lores controls differ – indication for possible effect of resolution • Introduce Ensemble Transform (ET) into GEFS breeding method • ET breeding method creates globally orthogonal initial perturbations • Uses simplex method to create individual (not paired) perturbations • This change is intended to improve probabilistic forecast skill • Results: Improved probabilistic forecast skill; Slightly reduced ensemble mean hurricane track errors for 12-96 hours • Changes of File Names and Structures
Ensemble Transform Bred Vector (New) Bred Vector (Current) Rescaling Rescaling P1 forecast P2 forecast P1 ANL ANL N1 P3 forecast P4 forecast t=t0 t=t1 t=t2 t=t0 t=t1 t=t2 P#, N# are the pairs of positive and negative P1 and P2 are independent vectors Simple scaling down (no direction change) P1, P2, P3, P4 are orthogonal vectors No pairs any more To centralize all perturbed vectors (sum of all vectors are equal to zero) Scaling down by applying mask, The direction of vectors will be tuned by ET. P2 ANL N2
Changes of File Names and Structures • Pressure GRIB Files Split into Two • Pgrba – 51 Variables For NAEFS Exchange • Pgrbb – Remaining 278 Variables • Perturbation runs from pairs to single size • P1, n1, p2, n2 … convert to p0, p02, p03, p04 … • Enspost.* and Ensemble.* Files Eliminated • Data Was Duplicate to Pressure GRIB Data Packed in Different Format • Ensemble Extensions Corrected in Pressure GRIB Files • 6-Hourly Precipitation/Max/Min Accumulations Available in Pressure GRIB Files • GEMPAK Files Created for NAEFS Members for Raw and Bias Corrected pgrba Files • GEMPAK Metafiles For HPC Medium Range Desk Created in Production
First Implementation of NAEFS – Summary • Bias corrected members of joint MSC-NCEP ensemble • Decaying accumulated bias (~past 50 days) for each var. for each grid point • For selected 35 of 50 NAEFS variables • 32(00Z), 15(06Z), 32(12Z) and 15(18Z) joint ensemble members • Bias correction against each center’s own operational analysis • Weights for each member for creating joint ensemble(equal weights now – unequal weights to be added later) • Weights don’t depend on the variables • Weights depend on geographical location (low precision packing) • Weights depend on the lead time • Climate anomaly percentiles for each member • Based on NCEP/NCAR 40-year reanalysis • Used first 4 Fourier modes for daily mean, • Estimated climate pdf distribution (standard deviation) from daily mean • For selected 19 of 50 NAEFS variables • 32(00Z), 15(06Z), 32(12Z) and 15(18Z) joint ensemble members • Adjustment made to account for difference between oper. & re-analysis • Provides basis for downscaling if local climatology available • Non-dimensional unit
Bias Correction Method & Application • Bias Assessment: adaptive (Kalman Filter type) algorithm decaying averaging mean error = (1-w) * prior t.m.e + w * (f – a) • For separated cycles, each lead time and individual grid point, t.m.e = time mean error 6.6% • Test different decaying weights. • 0.25%, 0.5%, 1%, 2%, 5% and • 10%, respectively • Decide to use 2% (~ 50 days) • decaying accumulation bias • estimation 3.3% 1.6% Toth, Z., and Y. Zhu, 2001 • Bias Correction: application to NCEP operational ensemble 15 members
List of Variables for Bias Correction, Weightsand Forecast Anomalies for CMC & NCEP Ensemble
NCO parallel for GEFS and statistic results • Start from 01/15/2006 (testing) • 14 perturbed runs and control for each cycle • With new file structures • Start from 02/01/2006 (real time parallel) • Adding ET scheme (03/07/2006) • Start from 04/10/2006 (NAEFS post products, partly) • Use GEFS new system (May implementation) • Create bias corrected forecast • Forecast anomalies • NCO real-time parallel verification statistics are posted at: • http://wwwt.emc.ncep.noaa.gov/gmb/yzhu/html/opr/prx_daily.html(available now) • Updated every morning • Retrospective experimental verification statistics are posted at: • http://www.emc.ncep.noaa.gov/gmb/yzhu/html/opr/et14m_daily.html(available now) • Updated, finished • Participated Evaluations
Summary of Retrospective and Parallel Runs • Period: • 08/20/2005 – 09/30/2005 (retrospective runs) • 03/01/2006 – 04/26/2006 (NCO real time parallel) • Statistics for • Hurricane track errors (retrospective runs only) • Atlantic-, East Pacific-, West Pacific- basins, total basins • RMS errors and AC scores for ensemble mean • NH and SH ex-tropic • Probabilistic verifications (ROC) • NH and SH ex-tropic • Conclusions • Tropical – mean of track error (slightly improved) • Improved (48-, 72-, 96-hours over all) • Northern hemisphere • Mean -improved from retrospective runs;-similar from NCO real time • Probabilistic (improved) • Southern hemisphere • Mean –similar from retrospective runs; -improved from NCO real time • Probabilistic (improved)
Hurricane Track Errors (Period: 08/20-09/30/2005) Atlantic Basin East Pacific Basin ENSs-operational ensemble ENSx-retrospective runs GFSs-operational GFS Hours Cases 174 157 141 128 101 75 48 Cases 181 165 149 135 109 85 69 West Pacific Basin All Basins Cases 177 161 145 129 101 66 44 Cases 532 483 435 392 311 226 161
Ensemble mean evaluations Improving skills from/after day 3 65% AC scores – useful skill Ens. extended add. 20 hours ENS_s – opr. ensemble ENS_x – real time parallel Northern Hemisphere RMSs are very similar ENS_s – opr. ensemble ENS_x – retrospective runs Much better than GFS after 72 hours Right – Real Time Parallel Left – Retrospective Runs Southern Hemisphere RMSs are very similar Improved
Probabilistic Evaluation (ROC) ENS_s – operational ensemble ENS_x – retrospective runs Improved Northern Hemisphere Improved ENS_s – operational ensemble ENS_x – real time parallel runs Left: Retrospective Runs Right: Real Time Parallel Improved Southern Hemisphere Improved
Summary of NAEFS First Implementation • Period: • 04/10/2006 – Current (NCO real time parallel) • Maps comparison for bias (before and after) • 500hPa height, 2m temperature • Statistics for • Bias reduction in percentage • Height, temperature, winds • RMS errors • Probabilistic verifications (ROC) • NH, SH and tropic • Conclusions • Bias reduced (approximately 50% at early lead time) • RMS errors improved by 9% for d0-d3 • Probabilistic forecast • Improved for all area, all lead time • Typically for NH, 20-24 hours improvement from d7
500hPa height: 120 hours forecast (ini: 2006043000) Shaded: left – raw bias right – bias after correction
2 meter temperature: 120 hours forecast (ini: 2006043000) Shaded: left – raw bias right – bias after correction
Bias Improvement (absolute value) after Bias correction Overall bias reduction: (globally) D0-3: 50% D3-8: 40% D8-15: 30% 500hPa height 850hPa temperature There is daily variation after bias correction, more bias reduced for valid 12Z cycle Sea level pressure 2m Temperature
Bias Improvement (absolute value) after Bias correction 10m V-component 10m U-component Overall bias reduction: (Tropic) D0-3: 50% D3-8: 45% D8-15: 40% Sea level pressure 2m temperature
Evaluation after bias correction (16 cases) Probabilistic skill Extended 20-h for d-7 Northern Hemisphere Southern Hemisphere Black-operational ensemble (10m) Red-real time parallel ensemble (14m) Green-real time parallel ensemble after bias correction (14m) RMS errors for ensemble mean reduced for 48-h forecast (~9%) Tropics
NAEFS Performance Review Improvement in Ensemble Forecasts Requirement Threshold Actual 25Apr-10May06 Variance Ensemble Mean 3-14 Day Lead Time Bias Reduction (%) 50% 30-70% Met or exceeded in Tropics & up to D3 elsewhere; slightly below otherwise RMS Error Reduction (%) 10% Up to 10% Met up to D3, below expected D4 and beyond Improvement in Ensemble-based Probabilistic Forecasts 3 Day 6 Hours 12 hrs Exceeded 7 Day 12 Hours 16 hrs Exceeded 10 – 14 Days 24 Hours 48 hrs Exceeded Appendix 6 KEY PERFORMANCE MEASURES
NAEFS Configuration Review (NCEP) FEATURE 2005 Plan 2008 Plan May 2006 Actual / Feb 2007 Plan(NCEP) Forecast lead time (days) 16 16 (35) 16 Number of cycles per day 2 (4) 4 4 Number of ensemble members 10 (20) 20 (50) 14 / 20 Model resolution (km) 120 (90) 80 (60) 120 / ? Number of vertical levels 28 (42) 42 (64) 28 / ? Appendix 8 MINIMAL (PREFERRED) CONFIGURATION FOR THE GLOBAL ENSEMBLE FORECAST SYSTEMS OPERATIONAL AT CMC AND NCEP
Summary of Subjective Analysis • HPC • Noted Two Month Evaluation Window Was Helpful and Better Evaluation Data Availability to HPC Compared to Previous Evaluations • Noted Parallel Mean Seemed to Hold Onto a Stronger MSLP Solution Well in the Medium Range Than Operational Mean • Individual Members Tended to Cluster on a Solution More Than Operational Version • Improved International Desk Confidence in Parallel Forecast of Certain Patterns in Southern Hemisphere • CPC • Based on Limited Set of Parallel Runs for D+8 and D+11 Forecasts, Anomaly Correlation Skill Scores Between Parallel and Operational System Were Similar • Slight Improvement in Score for the Southern Hemisphere Extratropics • OPC • Proposed Changes are Roughly Equal to the Current System for the Northern Hemisphere • On the Day to Day Noticed a Tendency for the Parallel Mean SLP Field to Better Cluster with Low Positions. Therefore in the Mean Ocean Cyclones Tended to Have Lower Pressure than the Operational Mean and More Resemble a Single Model Solution • Basically, the Mean Fields Appear More Realistic and Resemble Synoptic Scale weather Systems • SPC • Evaluated Primarily as Guidance for the Experimental Day 4 to 8 Severe Weather Outlook • Probabilistic Forecasts of Combined Severe Weather Parameters were Generally Equal or Better than Operational • 6-Hourly Output Very Helpful • Minimal (subjective) Differences Were Noted in Ensemble Mean Products
Summary of Subjective Analysis • TPC • The reruns from last year's hurricane season showed no significant degradations, and some slight improvements, to tropical cyclone track forecasts in the Atlantic basin in retrospective reruns. • Although there was some degradation of track forecasts for the eastern North Pacific, the sample for that basin was quite small. • The results from a global verification of track forecasts from that same period showed no significant degradations. • NWS KCTP • Detailed 11-12 May 2006 Case Study • Additional Members Were Great but the Anomaly Files Hold Incredible Promise. Huge Potential in These Data Just to Show the Probability of an Anomalous Forecast. This Relates Directly to the Emergent Focus in the NWS to Identify the “Significant” Events. • See a Bright Future in More Probabilistic “Alarm Bell” Maps Warning Forecasts of the Potential for Anomalies Associated with Big Precipitation Events, Snow Storms, etc. • General Improvement with Additional Members • New File Naming Conventions With P1-14 Versus P1-5 and N1-5 Made Data Easier to Work With • Air Force Weather Agency • Began Using Parallel Data Feed at End of April So Subjective Experience with Data Limited • Pleased with Switch from Breeding Modes to Ensemble Transform Initial Conditions • Acknowledgement of Data Arriving Incrementally as Forecast Runs Versus Distribution of Products at End of Forecast • To Effectively Support Joint Global Ensemble (JGE) Products and Running of Limited Area Ensembles AFWA and JEFS Still Need • More Data in PBL and Stratosphere • Horizontal Resolution needed to Increase to 0.5 Deg or Better
NAEFS Product Distribution Plans • Basic products: Bias corrected members, weights, climate percentiles • NCEP Service Centers – NAWIPS files • External users - ftp sites – GRIB2 distribution planned? • End Products • NCEP Service Centers: Interactive access via NAWIPS ensemble functionalities • NAWIPS ensemble demonstration planned after new NAWIPS release (22 May) • Scheduled product generation based on compiled request list, start ~ Dec 2006 • NCEP Service Centers – NAWIPS graphics • Web distribution: Gif images onto NCEP operational web site • NDGD Plans • Distribute bias corrected ensemble information on 1x1 lat/lon grid • 10, 50, 90 percentile values in NAEFFS forecast distribution (3 fields) • Associated climate percentiles (3 additional fields for downscaling applications) • Downscale bias corrected NAEFS members using RTMA analysis • Determine systematic difference (downscaling vector) between GFS and RTMA analyses • Distribute downscaling vector on NDGD grid
RAW & BASIC PRODUCT AVAILABILITY 2005, 2006, 2007, 2008
END PRODUCTS • End product generation • Can be center specific • Need to conform with procedures/requirements established at different centers • End products generated at NCEP • Based on prioritized list of requests from NCEP Service Centers • Graphical products (including Caribbean, South American, and AMMA areas) • NCEP official web site (gif – NA, Caribbean, SA, AMMA) • NCEP Service Centers (NAWIPS metafile) • Gridded products • NAWIPS grids • NCEP Service Centers (list of 661 products) • GRIB2 format • Products of general interest (Possible ftp distribution, no decision yet on products) • NDGD (10-50-90 percentile forecast value + associated climate percentile) • End products generated at MSC • TBD • End products generated jointly • Experimental probabilistic Week-2 forecast • Fully automated, based on basic products: bias corrected, weighted climate anomalies • Can become official product once performance reaches current operational level
ENSEMBLE FUNCTIONALITIES List of centrally/locally/interactively generated products required by NCEP Service Centers for each functionality are provided in attached tables (eg., MSLP, Z,T,U,V,RH, etc, at 925,850,700,500, 400, 300, 250, 100, etc hPa) Additional basic GUI functionalities:- Ability to manually select/identify members (TBS) - Ability to weight selected members Done, Sept. 05 Potentially useful functionalities that need further development: - Mean/Spread/Median/Ranges for amplitude of specific features (TBS)- Mean/Spread/Median/Ranges for phase of specific features (TBS)
ENSEMBLE PRODUCT REQUEST LIST NCEP SERVICE CENTERS, OTHER PROJECTS
NDGD FORECAST UNCERTAINTY - DOWNSCALING • Ensemble uncertainty information • Sent on NDGD grid for convenience (if no big overhead) • Valid on model grids (32km for regional, 110 km for global ensemble) • How to bridge gap between model and NDGD grids? • Anomaly uncertainty information – proposed methodology • Establish reanalysis climatology • In progress for global (NAEFS), methods can be transferred to regional reanalysis • Bias correct ensemble forecasts (wrt operational analysis) • Take 10-50-90 percentile values from bias corrected ensemble • (For establishing anomaly forecasts, adjust 10-50-90 percentile values to look like re-analysis) • Check climatological percentile corresponding to 10-50-90 forecast percentiles • Provide climatological percentiles corresponding to 10-50-90 percentile forecast values as second set of guidance products
Northern Hemisphere Southern Hemisphere Early studies for ET Winter of 2002-2003 ROC scores for 32 cases ENS-o control runs ENS-s ET-20 members ENS-x ET-10 members Tropical
Perturbation versus Error Correlation Analysis (PECA) Retrospective runs NCO parallel runs
There is no big effect in Tropical by apply ET in generally Ensemble mean Ensemble probabilistic Tropical scores for NCO real time parallel Probabilistic skills
Track errors and spreads2004 Atlantic Basin (8/23-10/1) From Timothy Marchok (GFDL) Reduced mean track errors and spreads
Hurricane track errors2 basins (Atlantic and e-Pacific) Percentage improvement to operational ensemble Track errors (miles) Period: 20040824-20040930 (53-103 cases)
Bias Improvement (absolute value) after Bias correction Overall bias reduction for Northern Hemisphere Bias – before/after bias correction
RMS errors before/after bias correction Opr. ROC scores for past 5 years
RPSS before/after bias correction RPSS performance for past 5 years
Update of NAEFS status from MSC • Data exchange • NCEP Grib1 data are received correctly at our end. We still are missing the NCEP analyses files pushed towards us. The reanalysis files are also missing, but it isn't as critical. At the moment, we're not able to produce debiased NCEP EPS fields. • We should plan to exchange the debiased fields on regular basis. This will ensure that we have correctly implemented the scripts on both sides. • A point was mentioned about the necessity to archive EPS files. We currently are archiving EPS MSC files and will archive the debiased field as well. We are planning to archive the NCEP EPS, but it will be for our own needs. • The direct link between NCEP and MSC should be reexamined. • Fields/variables • We should aim in having TIGGE and NAEFS variables as close as possible. • Plans • Plans for MSC EPS for 2007: • 20 members • 1 X 1 resolution • Only GEM model will be used • CMC analysis: • low resolution mean Kalman analysis • Others • Redundancy is necessary for contingency. • In order to plan for weighting algorithm, we should develop a testbed for weighting methodology.