Download
1 / 43
430 likes | 512 Views
Degradable Transport Networks: Quantifying the Unquantifiable. Professor Michael G H Bell ITLS, University of Sydney Business School. Scope of presentation. From Kobe 1995 to Christchurch 2011 Subjectivity of risk Societal risk averseness determines safety

E N D
Degradable Transport Networks: Quantifying the Unquantifiable Professor Michael G H Bell ITLS, University of Sydney Business School
Scope of presentation • From Kobe 1995 to Christchurch 2011 • Subjectivity of risk • Societal risk averseness determines safety • Transport network topology and vulnerability • Minmax loss and demon games • Hyperpaths • On-going research and development • Conclusions
Christchurch 2011*: Many older buildings crumbled *Thanks to Professor Alan Nicholson for a guided tour of Christchurch last week
Risk is subjective • Risk is likelihood of accident per unit time multiplied by the size of consequence • Future is uncertain so risk estimated not observable • Estimating risk involves judgement in • Defining scenarios, failure modes, etc • Devising experiments to determine failure rates • Consequently estimating risk is subjective
Empiricism (Evans, 2004) • Events (accidents) occur randomly at rate μ • Fatalities per accident also occur randomly with mean λ • Mean fatality rate is therefore μλ • Project forward mean fatality rate multiplied by the effect of the Train Protection and Warning System, … • Judgement still required so subjectivity remains
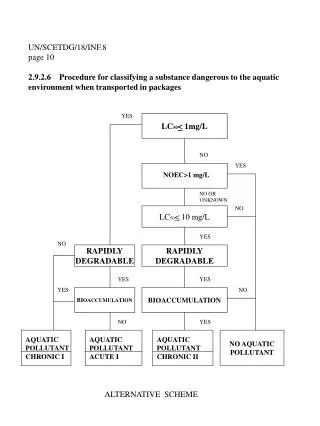
Boundary Consequence HE HE HE Causes Hazardous Events • Events with potential for death or injury • High frequency low consequence events • Routine, plentiful recorded data • Low frequency high consequence events • Rare, little recorded data
Boundary Consequence HE HE HE Causes Risk analysis • Scope definition: Set boundaries • Hazard identification: List hazardous events • Hazard analysis: • Research the causes of hazardous events • Estimate the consequences of hazardous events • Risk appraisal: Judge the tolerability of risks
Passenger train derailment Hazardous event OR Track fault Obstruction Over- speeding Rolling stock fault OR Broken rail Buckled rail Twisted rail B o u n d a r y o f t h e s y s t e m Fault tree
Hazardous event Train derails Does train maintain clearance? Yes No Does train obstruct adjacent line? No Yes Is there a collision with train on adjacent line? No Yes B o u n d a r y o f t h e s y s t e m Event tree
Problems with fault trees • Common causes leading to correlations in event likelihoods • Bias in fault tree construction due to information availability • Important causes over-looked • Assumptions of randomness
Subjectivity of risk analysis • Likelihood: • Is human error or a software crash random? • Have all failure modes been identified? • Is there sufficient historic data and, if so, have conditions remained constant? • Consequence: • Which is the “final” event in a chain? (Loss of life?) • Have all losses been identified? (Clean up costs?) • What is the worst credible case?
Plane accidents Weight or Disutility Train accidents Car accidents Size of accident Societal risk averseness affects safety
Road network for Switzerland Source: IVT at ETH, Zurich Generated by VISUM of PTV
Different network topologies Random network: Democratic distribution of connections (transport infrastructure) Scale-free network: Preferential attachment of new connections (transport tasks)
Random network: Transport infrastructure Typicalnode
Power Law Distribution of Node Linkages Scale-free network: Transport tasks
Topology, reliability and vulnerability • Scale-free networks tend to be • robust to random failure but • susceptible to attack • Random networks tend to be • susceptible to random failure but • robust to attack
Random network with random node failure Failed node Node Before After
Scale-free network with random node failure Failed node Hub Before After
Scale-free network under directed node attack Attacked hub Hub Before After
Societal risk aversion and demon games • Societal risk aversion shifts the focus from the likelihood of a hazardous event to its potential consequences • The planner, dispatcher, traveller is attracted to the option that minimises the maximum loss • This is equivalent to a demon game • As with empiricism, judgement still involved in defining scenarios, failure modes, etc.
Game of chess: Accidents caused by complexity • You plan to win • Your opponent observes your moves and plans to prevent you winning • An accident is a failure to foresee your opponent’s strategy • Too many possible strategies, so accidents inevitable
Town X Route B Route A City Y Routing strategies in an uncertain network
Town X Route B Route A City Y Demon game
Hyperpaths • Hyperpaths are sets of paths that are attractive (may be useful) • Alternatives are provided • Unattractive paths are not included • Hyperpaths can be generated by demon games • Density of the hyperpath depends on the size of potential losses • Single demon generates a denser hyperpath than node-specific demons ceteris paribus • Demons can be associated with failure scenarios • Great flexibility in defining hyperpaths • Hyperpaths are easy to generate • Node-specific demons may be solved by a version of the Spiess and Florian algorithm • All demon configurations lead to some form of LP
Hyperpath generation • Define scenarios (failure modes) and a cost or penalty for each scenario • Formulate a minmax problem: • Convert the problem to a linear program (LP): • Solve the LP, p defines the hyperpath and q are dual variables
On-going research: INSTR • 1995 Kobe earthquake and Iida initiative • EPSRC-funded research • Workshops on transport network reliability in Hong Kong, Newcastle and Ehime • 1st International Symposium on Transport Network Reliability (INSTR) in Kyoto, 2001 • 2nd INSTR in Christchurch, New Zealand, 2004 • 3rd INSTR in Delft, Holland, 2007 • 4th INSTR in Minneapolis, USA, 2010 • 5th INSTR in Hong Kong, 2012 • 6th INSTR in Nara, Japan, 2015
On-going research: Resilience in nature • Joint work with the Behaviour and Genetics of Behavioural Insects Lab • Ants and slime moulds have evolved supply chains over millions of years • Different kinds of ant and slime mould face different threats • Threats define the topology and use of networks • We are seeking funds to see what we can learn from nature to improve supply chain resilience
Conclusions • Likelihood of a HE is unquantifiable • Consequence of a HE is unquantifiable • Society is risk-averse so minmax consequences is a rational design and operational principle • Minmax consequences objective equivalent to demon games • Demon games lead to linear programs which define hyperpaths • However, when scenarios can be defined (and costed), the best usage of risky alternatives can be quantified! • Future research – learning from nature, specifically ants and slime mould, about how to design and use supply chains and transport networks resiliently.