Download
1 / 17
170 likes | 247 Views
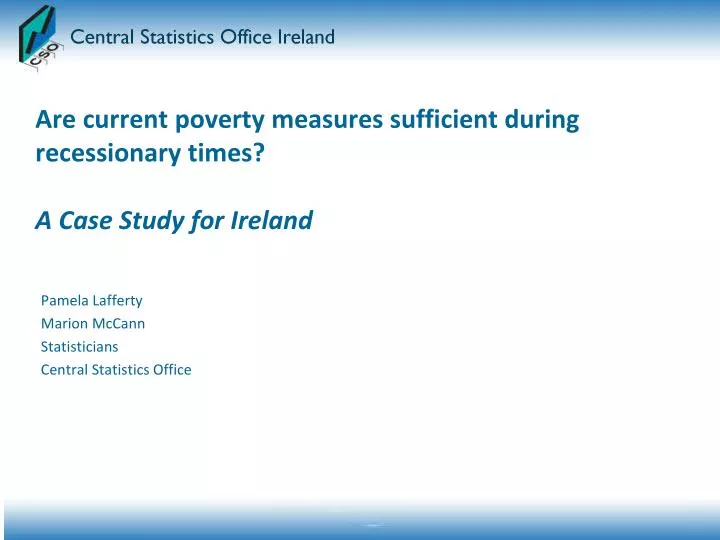
Are current poverty measures sufficient during recessionary times? A Case Study for Ireland. Pamela Lafferty Marion McCann Statisticians Central Statistics Office. Why should we consider a complementary measure?. Internationally recognised at risk of poverty rate (60% of median income)

E N D
Are current poverty measures sufficient during recessionary times?A Case Study for Ireland Pamela Lafferty Marion McCann Statisticians Central Statistics Office
Why should we consider a complementary measure? • Internationally recognised at risk of poverty rate (60% of median income) • Calculation is straightforward and does not require many subjective decisions on the part of the statistician • Relative measure • Not everyone’s income is variable – welfare dependent persons • At times of economic growth the rate rises e.g. 2005 rate=18.5% (GDP Growth = 6.2%) while in 2008 rate= 14.4% (GDP Growth = -3.0%) • Snapshot of household income in the year of the survey • Short and long term fluctuations AMELI Conference on Poverty Measure Methodology
Alternative measures • Alternative A: Expenditure based threshold • Establish a national equivalised expenditure based threshold (at 50%, 60% or 70%) and compare equivalised income with this threshold • Alternative B: Composition specific thresholds • Set income (at 60% ) and expenditure (at 50%, 60% and 70%) thresholds for 8 household types and compare disposable household income with each threshold AMELI Conference on Poverty Measure Methodology
Alternative measures • Why expenditure? • Expenditure maintained at a more constant level than income • Informs us of more permanent inequalities in welfare which income dispersion does not capture • Better representation of an individual’s average resources over their lifetime • Overcomes some of the difficulties of using relative measure based solely on income • Limitations • Expenditure is recorded, in this study, in a two week diary and interview • Misreporting of expenditure e.g. alcohol and tobacco • Periods of high and low expenditure • Purchase of a durable item AMELI Conference on Poverty Measure Methodology
Alternative measures • Data sources • EU Survey on Income and Living Conditions (EU SILC) 2005 and 2008 • Household Budget Survey 2004/2005 (HBS) • Up-rated 2005 HBS expenditure data to 2008 using the Consumer Price Index AMELI Conference on Poverty Measure Methodology
Alternative A: Expenditure based approach • Expenditure based threshold approach • Compare two different distributions at national level • An income versus expenditure approach • Equivalisation • Household expenditure is equivalised • Results • Expenditure thresholds were set at 50%, 60% and 70% of median equivalised expenditure. • Income threshold is the standard threshold at 60% of national median equivalised income. • Equivalised disposable income is compared against the thresholds mentioned above to establish if an individual is at risk of poverty • See Table 1 for results. AMELI Conference on Poverty Measure Methodology
Table 1 At risk of poverty threshold and rate by indicator and year AMELI Conference on Poverty Measure Methodology
Alternative B: Composition specific thresholds • Why use composition specific thresholds? • Ideally a specific basket of goods for each household type • Expenditure patterns of households vary significantly according to composition e.g. Elderly household 30% of median expenditure is on food; household with 2 adults and 1-3 children 19% of median expenditure is on food. • Costly to measure a basket of goods for each household type • Expenditure thresholds serve as an alternative to the ‘basket of goods’ method • Calculate poverty rates at the household level using both income and expenditure thresholds • Compare households with the same composition • Elderly households are compared with other elderly households • Limitations • Cannot compare income and expenditure of households across the 8 household types AMELI Conference on Poverty Measure Methodology
Alternative B: Composition specific thresholds • Develop an income and expenditure based threshold for each of the 8 household types • 1 adult aged 65 or over, no children under 18. • 1 adult aged less than 65, no children under 18. • 2 adults, at least one aged 65 or over, no children under 18. • 2 adults both aged less than 65, no children under 18. • 3 or more adults, no children under 18. • 1 adult with children under 18. • 2 adults with 1-3 children under 18. • Other households with children under 18. AMELI Conference on Poverty Measure Methodology
Alternative B:Composition specific thresholds • Median household income of households within a household type category • Threshold set at 60% of median household income • Median household expenditure of households within a household type category • Threshold set at 50%, 60% and 70% of median household expenditure • Disposable household income is compared against each threshold to establish the household poverty rate AMELI Conference on Poverty Measure Methodology
Table B At risk of poverty rate by household composition, indicator and year
Table C At risk of poverty threshold and rate for households with one adult of working age (aged <65) by indicator and year AMELI Conference on Poverty Measure Methodology
Figure 2 At risk of poverty rates for households with one adult of working age (aged < 65) by indicator and year, SILC 2005-2008 and HBS 2004/2005 AMELI Conference on Poverty Measure Methodology
Conclusions • Expenditure poverty rates (at 60% and 70% national thresholds) are significantly higher than the income poverty rate (60% national threshold) => Individuals are frequently spending more than they earn • Source of extra income? • Expenditure based measure is a supportive indicator => ability to capture aspects of the flow of individuals into and out of poverty • Composition-specific threshold analysis highlighted household types that were more at risk => e.g. Households with one adult of working age (aged <65) and households with children AMELI Conference on Poverty Measure Methodology
Conclusions • Are current poverty measures sufficient during recessionary times? => Yes, to a degree. Income and expenditure based poverty rates show the same pattern over time but poverty rates calculated using the 60% or 70% expenditure threshold are significantly higher than the income based rates. => Composition specific threshold analysis has the ability to add value to the body of indicators currently available, by giving more detail regarding the position of a household compared with households of the same composition in Ireland. => Therefore ,we recommend that the alternative measures discussed should be calculated to supplement the internationally recognised measure of poverty (60% of median equivalised income). AMELI Conference on Poverty Measure Methodology
Questions? AMELI Conference on Poverty Measure Methodology