Download
1 / 1
10 likes | 131 Views
METAL FOIL DETECTORS AND THEIR APPLICATIONS. V. Pugatch a,b , V. Aushev a,c , C. Bauer b , K.-T. Kn ö pfle b , M. Schmelling b , M.Tkatch a , Yu. Vassiliev a,c a Kiev Institute for Nuclear Research, b Max-Plank-Institut f ür Kernphysik, c Deutsche Elektronen-Synchrotron DESY.

E N D
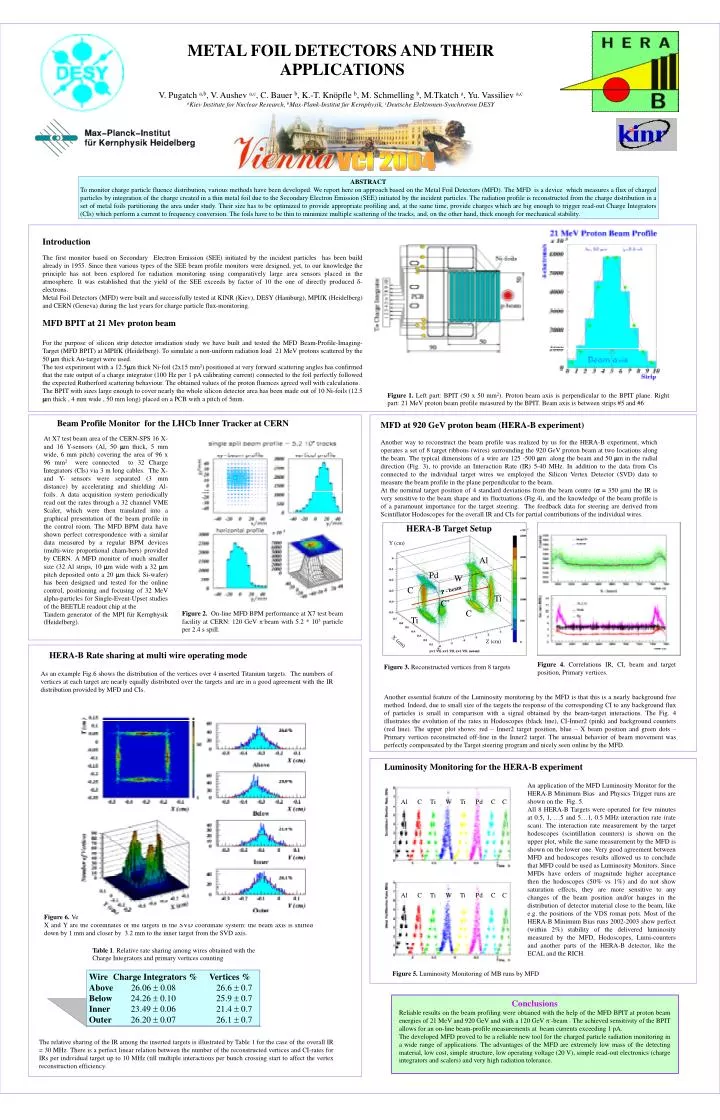
METAL FOIL DETECTORS AND THEIR APPLICATIONS V. Pugatch a,b, V. Aushev a,c, C. Bauer b, K.-T. Knöpfle b, M. Schmelling b, M.Tkatch a, Yu. Vassiliev a,c aKiev Institute for Nuclear Research, bMax-Plank-Institut für Kernphysik, cDeutsche Elektronen-Synchrotron DESY VCI 2004 ABSTRACT To monitor charge particle fluence distribution, various methods have been developed. We report here on approach based on the Metal Foil Detectors (MFD). The MFD is a device which measures a flux of charged particles by integration of the charge created in a thin metal foil due to the Secondary Electron Emission (SEE) initiated by the incident particles. The radiation profile is reconstructed from the charge distribution in a set of metal foils partitioning the area under study. Their size has to be optimized to provide appropriate profiling and, at the same time, provide charges which are big enough to trigger read-out Charge Integrators (CIs) which perform a current to frequency conversion. The foils have to be thin to minimize multiple scattering of the tracks, and, on the other hand, thick enough for mechanical stability. Introduction The first monitor based on Secondary Electron Emission (SEE) initiated by the incident particles has been build already in 1955. Since then various types of the SEE beam profile monitors were designed, yet, to our knowledge the principle has not been explored for radiation monitoring using comparatively large area sensors placed in the atmosphere. It was established that the yield of the SEE exceeds by factor of 10 the one of directly produced -electrons. Metal Foil Detectors (MFD) were built and successfully tested at KINR (Kiev), DESY (Hamburg), MPIfK (Heidelberg) and CERN (Geneva) during the last years for charge particle flux-monitoring. MFD BPIT at 21 Mev proton beam For the purpose of silicon strip detector irradiation study we have built and tested the MFD Beam-Profile-Imaging-Target (MFD BPIT) at MPIfK (Heidelberg). To simulate a non-uniform radiation load 21 MeV protons scattered by the 50 m thick Au-target were used. The test experiment with a 12.5m thick Ni-foil (2x15 mm2) positioned at very forward scattering angles has confirmed that the rate output of a charge integrator (100 Hz per 1 pA calibrating current) connected to the foil perfectly followed the expected Rutherford scattering behaviour. The obtained values of the proton fluences agreed well with calculations. The BPIT with sizes large enough to cover nearly the whole silicon detector area has been made out of 10 Ni-foils (12.5 m thick , 4 mm wide , 50 mm long) placed on a PCB with a pitch of 5mm. Figure 1. Left part: BPIT (50 x 50 mm2). Proton beam axis is perpendicular to the BPIT plane. Right part: 21 MeV proton beam profile measured by the BPIT. Beam axis is between strips #5 and #6 Beam Profile Monitor for the LHCb Inner Tracker at CERN MFD at 920 GeV proton beam (HERA-B experiment) Another way to reconstruct the beam profile was realized by us for the HERA-B experiment, which operates a set of 8 target ribbons (wires) surrounding the 920 GeV proton beam at two locations along the beam. The typical dimensions of a wire are 125 -500 m along the beam and 50 m in the radial direction (Fig. 3), to provide an Interaction Rate (IR) 5-40 MHz. In addition to the data from Cis connected to the individual target wires we employed the Silicon Vertex Detector (SVD) data to measure the beam profile in the plane perpendicular to the beam. At the nominal target position of 4 standard deviations from the beam centre ( = 350 m) the IR is very sensitive to the beam shape and its fluctuations (Fig.4), and the knowledge of the beam profile is of a paramount importance for the target steering. The feedback data for steering are derived from Scintillator Hodoscopes for the overall IR and CIs for partial contributions of the individual wires. At X7 test beam area of the CERN-SPS 16 X- and 16 Y-sensors (Al, 50 mthick, 5 mm wide, 6 mm pitch) covering the area of 96 x 96 mm2 were connected to 32 Charge Integrators (CIs) via 3 m long cables. The X- and Y- sensors were separated (3 mm distance) by accelerating and shielding Al-foils.A data acquisition system periodically read out the rates through a 32 channel VME Scaler, which were then translated into a graphical presentation of the beam profile in the control room. The MFD BPM data have shown perfect correspondence with a similar data measured by a regular BPM devices (multi-wire proportional cham-bers) provided by CERN. A MFD monitor of much smaller size (32 Al strips, 10 m wide with a 32 mpitch deposited onto a 20 mthick Si-wafer) has been designed and tested for the online control, positioning and focusing of 32 MeV alpha-particles for Single-Event-Upset studies of the BEETLE readout chip at the Tandem generator of the MPI für Kernphysik (Heidelberg). HERA-B Target Setup Y (cm) Al Pd W C P - beam Ti C* C Figure 2. On-line MFD BPM performance at X7 test beam facility at CERN: 120 GeV -beam with 5.2 * 105 particle per 2.4 s spill. Ti X (cm) Z (cm) HERA-B Rate sharing at multi wire operating mode Figure 4. Correlations IR, CI, beam and target position, Primary vertices. Figure 3. Reconstructed vertices from 8 targets As an example Fig.6 shows the distribution of the vertices over 4 inserted Titanium targets. The numbers of vertices at each target are nearly equally distributed over the targets and are in a good agreement with the IR distribution provided by MFD and CIs. Another essential feature of the Luminosity monitoring by the MFD is that this is a nearly background free method. Indeed, due to small size of the targets the response of the corresponding CI to any background flux of particles is small in comparison with a signal obtained by the beam-target interactions. The Fig. 4 illustrates the evolution of the rates in Hodoscopes (black line), CI-Inner2 (pink) and background counters (red line). The upper plot shows: red – Inner2 target position, blue – X beam position and green dots – Primary vertices reconstructed off-line in the Inner2 target. The unusual behavior of beam movement was perfectly compensated by the Target steering program and nicely seen online by the MFD. Luminosity Monitoring for the HERA-B experiment An application of the MFD Luminosity Monitor for the HERA-B Minimum Bias and Physics Trigger runs are shown on the Fig. 5. All 8 HERA-B Targets were operated for few minutes at 0.5, 1, …5 and 5…1, 0.5 MHz interaction rate (rate scan). The interaction rate measurement by the target hodoscopes (scintillation counters) is shown on the upper plot, while the same measurement by the MFD is shown on the lower one. Very good agreement between MFD and hodoscopes results allowed us to conclude that MFD could be used as Luminosity Monitors. Since MFDs have orders of magnitude higher acceptance then the hodoscopes (50% vs 1%) and do not show saturation effects, they are more sensitive to any changes of the beam position and/or hanges in the distribution of detector material close to the beam, like e.g. the positions of the VDS roman pots. Most of the HERA-B Minimum Bias runs 2002-2003 show perfect (within 2%) stability of the delivered luminosity measured by the MFD, Hodoscopes, Lumi-counters and another parts of the HERA-B detector, like the ECAL and the RICH. Al C Ti W Ti Pd C C Al C Ti W Ti Pd C C Figure 6. Vertices distribution over 4 targets surrounding the 920 GeV proton beam (IR = 30 MHz). X and Y are the coordinates of the targets in the SVD coordinate system: the beam axis is shifted down by 1 mm and closer by 3.2 mm to the inner target from the SVD axis. Table 1. Relative rate sharing among wires obtained with the Charge Integrators and primary vertices counting Figure 5. Luminosity Monitoring of MB runs by MFD Wire Charge Integrators % Vertices % Above 26.06 0.08 26.6 0.7 Below 24.26 0.10 25.9 0.7 Inner 23.49 0.06 21.4 0.7 Outer 26.20 0.07 26.1 0.7 Conclusions Reliable results on the beam profiling were obtained with the help of the MFD BPIT at proton beam energies of 21 MeV and 920 GeV and with a 120 GeV --beam . The achieved sensitivity of the BPIT allows for an on-line beam-profile measurements at beam currents exceeding 1 pA. The developed MFD proved to be a reliable new tool for the charged particle radiation monitoring in a wide range of applications. The advantages of the MFD are extremely low mass of the detecting material, low cost, simple structure, low operating voltage (20 V), simple read-out electronics (charge integrators and scalers) and very high radiation tolerance. The relative sharing of the IR among the inserted targets is illustrated by Table 1 for the case of the overall IR = 30 MHz. There is a perfect linear relation between the number of the reconstructed vertices and CI-rates for IRs per individual target up to 10 MHz (till multiple interactions per bunch crossing start to affect the vertex reconstruction efficiency.