Download
1 / 11
110 likes | 228 Views
Progress Toward a New Weather Generator. Eric Schmidt , Colorado State University - Pueblo Dr. James O’Brien, Florida State University Anthony Arguez, Florida State University. Abstract.

E N D
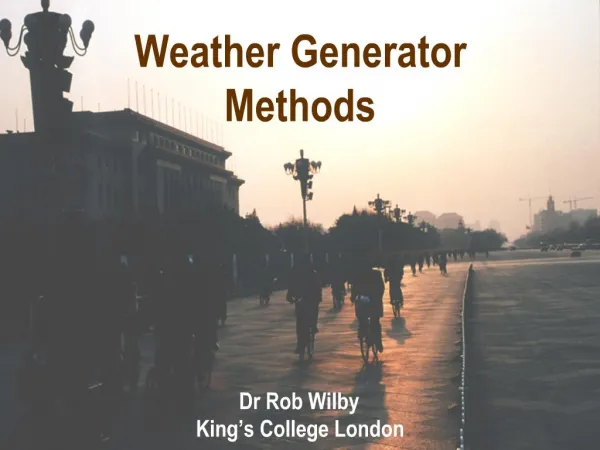
Progress Toward a New Weather Generator Eric Schmidt , Colorado State University - Pueblo Dr. James O’Brien, Florida State University Anthony Arguez, Florida State University
Abstract A weather generator is developed using Fourier Analysis on pre-recorded El Niño January data from the Tallahassee Regional AP Weather Station. Spectral methods are then applied to carry through the characteristics of the minimum and maximum temperature. The application of statistical methods is employed to increase confidence of maintaining the physical properties and correlations held by the minimum and maximum temperatures for El Niño Januaries.
Introduction • Models of empirical daily weather series are repeatedly used in water engineering design and agricultural, ecosystem or climate change situations due to the limitations of recorded ground-based meteorological data in terms of their length, completeness, or spatial coverage. • Using Fourier and spectral analysis, a new method is implemented to produce synthetic weather data, using previously recorded minimum/maximum temperature from the Tallahassee Regional AP Weather Station. This process is new in that it uses the spectral domain to generate this synthetic temperature instead of the norm of creating in the time domain. • The El Niño-Southern Oscillation (ENSO) is the leading mode of inter-annual variability over the United States. ENSO is associated with anomalous sea surface temperatures in the equatorial Pacific Ocean. However, ENSO impacts extend far away from this region due to realigning global weather patterns. Over Florida, in particular, the temperature tends to be colder during El Niño events and warmer during La Niña events. • The model assumes that both monthly minimum temperature and maximum temperature are Gaussian variables.
Model Construction From the Tallahassee Regional Weather Station, we collected temperature data for 13 El Niño Januaries starting in 1952: knt Minimum temperature time series, n = 1 (1) 31, t = 1 (1) 13 mnt Maximum temperature time series, n = 1 (1) 31, t = 1 (1) 13 Prior to Fourier Analysis, the Monthly mean was removed from each of the 13 data sets. Using IDL’s built in FFT function (Eq. 1), the thirteen time series were converted to spectral space. From these spectral estimates, an ensemble average spectral estimate for minimum temperature (Figure 1) and an ensemble average spectral estimate (Eq. 6) for maximum temperature were created. This average Spectrum is symmetric about the Nyquist Frequency, which occurs at position 15/31, thus Figure 1 only depicts frequencies 0-15.
Model Construction (cont.) Hf is created by taking the respective square roots of the average spectral estimates for the recorded minimum and maximum temperatures. From here, a white noise, or random data, series xn was created from a uniform distribution with mean zero, variance one. This white noise has no preference to a particular time scale and it’s spectrum, XfXf* is a constant. From this data set, Xf (Eqs. 2,4,3) is then created from IDL’s FFT function (Eq. 1).
Future Work • Some of the results found throughout this research led to un-anticipated problems. The following is a list of ideas of future work in this project: • Add the slope of the recorded temperatures because the synthetic data is lacking spectral energy at the lower frequencies • Utilize the difference between maximum temperature and minimum temperature to • Redo spectral type analysis on the difference between maximum and minimum temperature to model their co-variation. Then either add this to the generated minimum temperature or subtract this from the generated maximum temperature. • Simulate minimum temperature, then use the normality and the difference between maximum and minimum temperature to create a distribution to offset/adjust maximum temperature. • Add precipitation to this multivariate weather generator
References Wilks, D.S., and R.L. Wilby, 1999. The weather generation game: a review of stochastic weather models. Progress in Physical Geography, 23, 329-357. Marine Department, Japan Meteorological Agency, 1991: Climate charts of sea surface temperatures of the western North Pacific and the global ocean. 51 pp. Bendat, Julius S., and Allan G. Piersol. 2000. Random Data: Analysis and Measurement Procedures. Wiley, John & Sons, Incorporated.