Download
1 / 33
350 likes | 450 Views
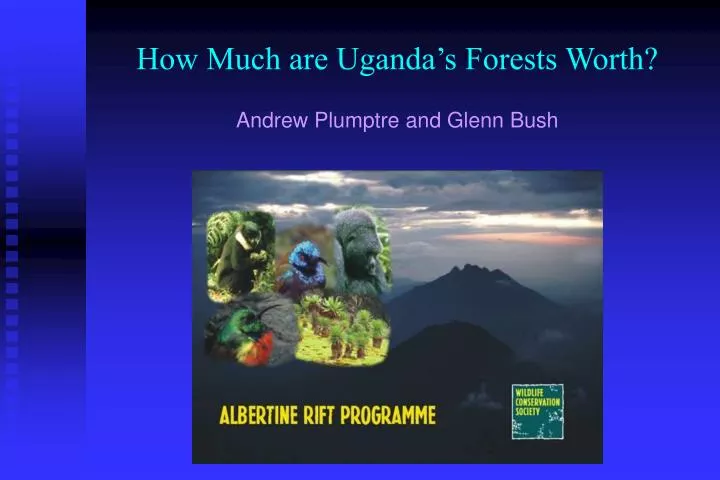
How Much are Uganda’s Forests Worth? Andrew Plumptre and Glenn Bush. The Albertine Rift – Africa’s Western Rift. Land of people and exceptional biodiversity. Highest vertebrate species richness in Africa Highest numbers of endemic and threatened vertebrates

E N D
How Much are Uganda’s Forests Worth?Andrew Plumptre and Glenn Bush
Land of people and exceptional biodiversity • Highest vertebrate species richness in Africa • Highest numbers of endemic and threatened vertebrates • High Human population density in the Albertine Rift • 200-600/km2 • People are very poor and livelihoods are insecure • Conservation challenge to conserve biodiversity and alleviate poverty
WCS Activities in the Albertine Rift • Site Based Conservation – Greater Virunga Landscape • Transboundary collaboration • Landscape species –lions, elephants, golden cats • Business planning/sustainable financing • Research • Biodiversity Surveys • Endemic/threatened species monitoring • Socioeconomic studies • Corridors • Baselines for monitoring • Capacity Building • National Monitoring and Research Plans for Uganda, Rwanda and Tanzania
WCS Activities in the Albertine Rift - 2 • Policy • Value of Protected Areas • ICD Project effectiveness • Landscape planning in northern Uganda • New Model Development • Testing a market-based approach to community conservation • Ex Situ Collaboration • Uganda Wildlife Education Centre
Forest Valuation • Protected areas seen by government as potentially free land for private investors • Pressures to de-gazette the less valuable areas – particularly in Uganda • National accounts only value the mainstream trade from forests • Budget planning processes do not value hidden benefits to the local and national economy
Why consider the broader values? • Need to better link conservation to poverty alleviation • Show importance of forests to economic growth and development • Demonstrate that forests are important in the livelihoods of many rural people • To develop a more sustainable and integrated approach to forest management • To influence policy and budgetary processes
Environmental Economics Total Economic Value = Direct + Indirect values
Forest Valuation in the Ugandan Context • Poverty Reduction Strategy Process • Poverty Eradication Action Plan • Focused on poverty alleviation • Drives international donor support • Forestry/environment left out of early PEAP but included in a recent revision
Previous Forest Valuations Uganda has some good studies on the economics of forests: • Peter Howard (1995)The Economics of Protected Areas in Uganda; Costs Benefits and Policy Issues • Falkenberg and Sepp (1999) “Economic Evaluation of the Forest Sector in Uganda” • Emerton & Muramira 1999, " Uganda Biodiversity: An economic assessment • Yaron et al (2003) "The role of the environment in increasing growth and reducing poverty in Uganda" These were an important start
Limits of Previous Forest Valuations However: • Mainly macro in their scope • Did not collect wealth disaggregated data on the economics of forest livelihoods. • Supported the need to collect such data
Study Sites Budongo Bugoma Rwenzori Kasagala N
Methods: 1. Household Survey • Use of Forest Products • Timber, fuelwood, charcoal • building poles, bean stakes, lianas,rattan, medicinal plants, bushmeat • Division of households into wealth categories • Contribution to Annual Income • Qualify role of forests in livelihoods security and lessening vulnerability. • 696 households, 48 villages
Source Data Type Uganda Bureau of Statistics Demographic Forestry Department Biomass Department Timber revenues by district Timber marketing and management data Forest Tourism revenues Uganda Wildlife Authority/Uganda Tourism Department Tourism Revenues in National Parks and other areas Ministry of Agriculture Land use data Ministry of Finance Economic indicators for key natural resources, and Trade Figures Makerere University, Faculty of Agriculture Selected farm management data Method: 2. Evaluation of Secondary Data • A significant body of national data are available on which to base estimates of ecosystem and other services
Livelihoods - Income • Rwenzori higher total value of income and consumption as well as income from forest and proportion of income from forest
Home consumption vs sale • Forest goods in all forests tended to be consumed in the home • Lower in Kasagala – because of the charcoal industry
Livelihoods- forest income type Woody FP = sawn wood, fuel wood and charcoal • Rwenzori significantly greater proportion of income from Non-Timber Forest Products (NTFPs) • Budongo lower timber income than might be expected, - enforcement, pitsawyers not from local community?
Breakdown of NTFPs aNTFP not including wild animals, and birds bTimber, firewood, charcoal etc cWild mammals and birds dElephant, buffalo and larger antelopes eDuiker and smaller mammals such as rats, bush pigs
Livelihoods – Wealth and forest use • In Budongo, Kasagala and Rwenzori there was no significant difference found between wealth groups in absolute forest income • In percentage terms the poorest households derived significantly more income from forests than the wealthier categories. • This is a strong indicator of the economic reliance that poor people have on forests.
Household size and distance from forest • Positive correlation between household size and forest use • Positive correlation between household size and wealth • Negative correlation between distance from forest and forest income
Seasonality • Positive correlation between the months when the forest was used most with: -Months in which food must be bought -Months when cash needed most • Corresponds to the dry season months and ‘Hungry Gap’ • Clearly shows the role forests play in reducing vulnerability from seasonal shocks
Livelihoods- Value per Ha to households aNational Biomass Study 2003 bUBOS, Census 1992 cThe area of riverine and gallery forest south of Bugoma forest reserve, not the forest reserve itself. • Rwenzori highest value to local households • BUT Current use values are probably unsustainable
Livelihoods National Values – Forest Type • Highest per ha values for wood-based products (‘Timber’) from Savannah Woodland – charcoal • Highest per ha values for NTFPs in Afromontane forest – home consumption
Other Direct values • Tourism - $1.4 million • Timber revenues - $8.5 million • Forage values - $20 million
Ecosystem Values • Water • 59.3% of all respondents obtained water from local forests • Value of domestic water from forests is about $35.8 million/year • Soil Fertility • Replacement cost of $58.3 million/year - using mineral fertiliser to replace nutrients lost • Carbon • Carbon sequestration was valued at $33.1 million/year • Biodiversity • Valued at $3.4 million/year
Breakdown of TEV Timber only accounts for 7% of Forest values Only 10% of TEV accrues to Global Community (carbon and biodiversity) 90% of TEV contributes directly to the Ugandan Economy
National Context – GDP • Estimate from this study currently at 5.2% of GDP (2002 figure) • But an increase in real terms in the estimated value of forests • $275.5 million in 1998 to $350 million in 2003 • $75 million increase is primarily due to better data on people’s use of the forest
Policy Recommendations Local • Current forest use is unsustainable • Making rural households wealthier will not reduce the exploitation of forest resources • In the short term there is every indication that forest exploitation will increase • Need to integrate local people in forest management as resources are too few to police
Policy RecommendationsNational • Public goods need to be funded from Treasury • Need to develop a sector investment plan to integrate the needs of the forestry sub-sector into the GOU budgetary process • Coordinate forest management and rural development to reduce impacts of any move to sustainability
Policy Recommendations International • Need for International Financing for global benefits: • GEF and World Bank Bio Carbon Fund • In addition finances from carbon offset schemes and debt for nature swaps should also be investigated • Promote the fact that funding forest conservation also contributes to poverty alleviation
Poverty Alleviation and conservation Results show forests are important for: • Increased incomes for poor • Maintaining quality of life • Reducing seasonal stress and vulnerability • Important to local and macro economic development
Linking forest valuation to business planning • It is clear that forests in Uganda have value • How do we get people who can afford it to realise the value and contribute to the conservation of the resource? • Business planning is a tool that has the potential to do this.
European Union FOREST RESOURCES MANAGEMENT AND CONSERVATION PROGRAMME Thank You Funding provided by: European Union/FRMCP Daniel K. Thorne Foundation John D. and Catherine T. MacArthur Foundation Wildlife Conservation Society