Download
1 / 14
140 likes | 245 Views
Establishing Baseline Performance Scores for the CAGEN Robust Gene Response Challenge. Shaunak Sen Caltech CDS Dec 14, 2011. CAGEN - C ritical A ssessment of G enetically E ngineered N etworks Systematize the design of genetic networks

E N D
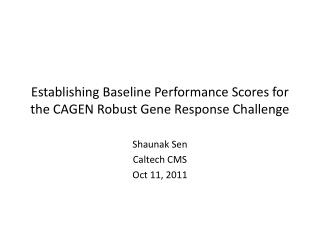
Establishing Baseline Performance Scores for the CAGEN Robust Gene Response Challenge Shaunak Sen Caltech CDS Dec 14, 2011
CAGEN - Critical Assessment of • Genetically Engineered Networks • Systematize the design of genetic networks • (address issues of robustness, connectability) • - Facilitate applications, for ex. in agriculture, medicine
CAGEN Challenge #1 : Robust Gene Response Induce OUTPUT (YFP) in response to INPUT (IPTG), so that, Detectable: >10 fold induction Robust: Low variability across cells & temperatures Fast: Quick response Speed >10 X0 Low Variability OUTPUT YFP induction 1 X0 Time IPTG Addition INPUT
PurposeEstablish Baseline Performance Challenge Specifications Purpose: Establish Baseline Performance Score for Self Assessment And Critical Assessment ANNOUNCEMENT Self Assessment by Participants SELECTION Critical Assessment of Selected Designs
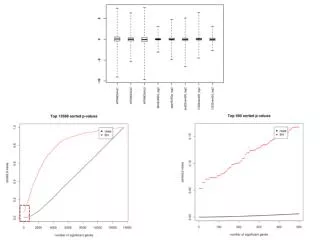
Performance metric to score robustness and speed of designs Time integral of square error Worst Case j = 1, 2, 3,… 15 (at least 5 traces for 3 temperatures) Normalizing factor (equilibrium amplitude of reference trace) r(t) is a trace chosen as reference, Mis equilibrium amplitude of r(t), T1is time when r(t) is 10%of M, and T2is time after which r(t) stays within 10%of M. Small Output X Px x Time Input
Single cell dynamics are measured for a simple reference design, for different temperatures #2 #1 Pinducible YFP E. coli Plac Plac cI-yfp yfp IPTG IPTG
Movies Pinducible YFP
Reference trace exhibits > 10x induction Cell division Mean Fluorescence (a.u.) 10x induction No induction Camera Bgd. Time (minutes)
Baseline Performance Score for Self AssessmentPerformance scores for inducible protein expression circuits #2 #1 Reference trace (32 °C) Traces at 32 °C Traces at 34 °C Traces at 30 °C Reference trace (34 °C) Traces at 34 °C Traces at 30 °C S = 1.45 S = 1.22 Mean Fluorescence (a.u.) Mean Fluorescence (a.u.) Plac Plac cI-yfp yfp IPTG IPTG Time (minutes) Time (minutes)
Critical assessment will be on a μfluidic platform allowing for controlled induction time Pinducible GFP Simulation/ Eric Klavins E. coli Plac gfp Benefit #2: Similar decay time measurement. Benefit #1. Exact induction time measurement. IPTG
Movie Plac GFP
Single-Cell Dynamics with Controlled Induction Time S = 2.29
Population level metric to estimate performance score Population Dynamics/ Flow Cytometry Single-Cell Dynamics/ Microscopy X Px x
Future WorkFast Linear Amplifier in 3 Steps 2. Fast Decay 1. Fast Increase 3. Linear Response (this CAGEN Challenge) Small Output Output Input Time Input Small Output Time Input