Download
1 / 18
180 likes | 502 Views
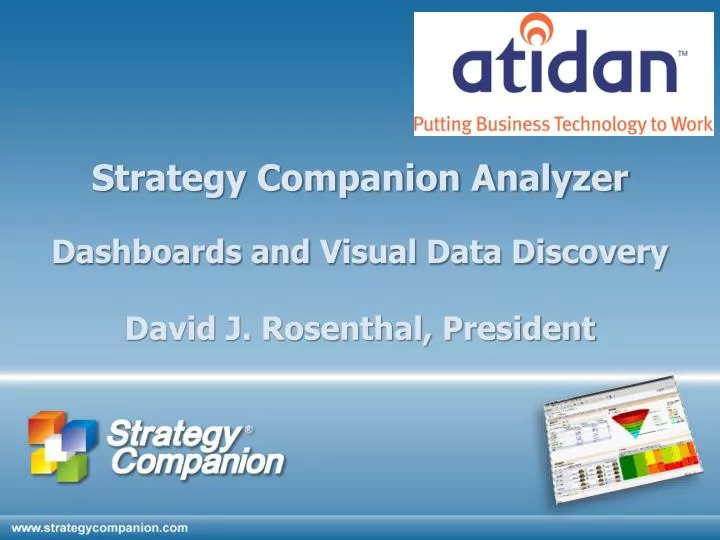
Strategy Companion Analyzer. Dashboards and Visual Data Discovery David J. Rosenthal, President. Strategy Companion Analyzer - Overview. Dashboard Design, Layout & Presentation. Multiple data sources Multiple visual indicators Interactive Integrated Smart visualizations

E N D
Strategy Companion Analyzer Dashboards and Visual Data Discovery David J. Rosenthal, President
Dashboard Design, Layout & Presentation • Multiple data sources • Multiple visual indicators • Interactive • Integrated • Smart visualizations • Speed time to insight • Actionable • 100% Web authoring and administration • Designed for non-technical business users • User defined and pre-built expressions • Easy to define interactions • Enterprise, SaaS and OEM versions • Strong visual appeal • Multiple panels, layers, and tabs • Multiple data sources (OLAP, Relational, Excel, Access) • Less common chart types • Intelligent Maps, Trellis, Spark lines, Bullet graphs, Heat maps
Analyzer™ - Intuitive Business Intelligence • 100% Zero-Footprint (IE) • Multiple Components/Sheets • Step List Function • Bookmark Function • Message Function • Multiple Languages • Web and SSRS Links • Export to Excel • SharePoint deployment • Security (AD, SSO) • Drag and Drop Design • Advanced Filter Function • Intelligent Mapping • Heat Mapping • Conditional Formatting • Quick Charts • User-based Subscriptions • KPI Management Viewer • All Charts are dynamic • Drilldown /Expand /Filter/Pivot
Analytic Chart Features • Wide variety of Chart Types • User-Defined Color Themes • Lock / Unlock function • Grouping with PivotTable • One-Click Copy Chart • Zoom In / Zoom Out • 2D /3D Switch Dynamically • Transparent Effect • Advanced Axes Setting • Drilldown / Expand / Filter / Pivot
Analyzer - Visual Data Discovery • Less common chart types • Trellis, Intelligent map, Heat map, Spark line, Bullet Graphs • Highly interactive • May be used as personal analytic tool
Architecture • Load balancing and failover • Real-time or scheduled updates • Multiple data sources and content type • Web and Reporting Services link, OLAP, Relational, File – Excel and Access • 64-bit
Dashboard Consumption: Delivery • Alerts – Email and Conditional formatting on dashboard based on user defined thresholds. • Mobile support • Other viewing environments • SharePoint Web Parts for 2007, 2010 • Standard and Enterprise • Export to Excel, HTML, CSV
Analyzer Mobile™ BI Analyzer Mobile™ Business Intelligence for iPhone, iPad, BlackBerry, & Android Devices Demo site: http://tinyurl.com/mobile-biUser ID: analyzer Password: mobile