Download
1 / 35
380 likes | 535 Views
Particle Identification. Graduate Student Lecture Part 2 Warwick Week. S.Easo, 19-20 April 2012. Outline. Lecture 1 :. Introduction Cherenkov Detectors. Main techniques for Particle Identification (PID) Main principles Photodetectors

E N D
Particle Identification Graduate Student Lecture Part 2 Warwick Week S.Easo, 19-20 April 2012
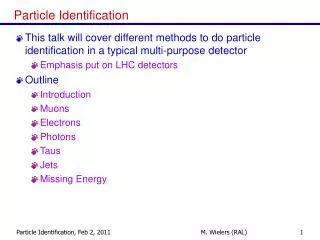
Outline Lecture 1 : • Introduction • Cherenkov Detectors • Main techniques for Particle Identification (PID) • Main principles • Photodetectors • Example of large Cherenkov Detector in HEP Lecture 2 : • Detectors using Energy Loss (dE/dx) from ionization • and atomic excitation • Time of Flight (TOF) Detectors • Transition Radiation Detectors (TRD) • More Examples of PID systems • Astroparticle Physics • Not Covered : PID using Calorimeters • Focus on principles used in the detection methods.
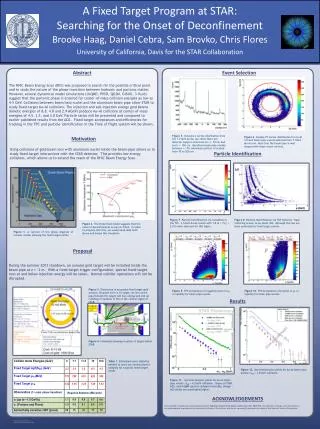
Momentum range for PID detectors Typical ranges: • Hadron PID over large momentum range (1-100 GeV/c ) • with high resolution : RICH with appropriate radiators. • Requires large radiator length. • PID in the 1-5 GeV/c range: DIRC (using Cherenkov effect), • detector using energy loss (dE/dX) . • PID in the 1-6 GeV/ range: Time of flight (TOF) . • In the future up to 10 GeV/c. • Electron-Pion separation : Transition radiation detectors (TRD). • PID in the TeV range (astroparticle detectors): Cherenkov effect from • secondary particles which are at relatively • lower momentum.
DIRC PRINCIPLE • If n>2 some photons are always totally internally reflected for b1 tracks. • Radiator and light guide: Long, rectangular Synthetic Fused Silica (“Quartz”) bars (Spectrosil: average <n(l)> 1.473, radiation hard, homogenous, low chromatic dispersion) • Photons exit via wedge into expansion region • (filled with 6m3 pure, de-ionized water). • Pinhole imaging on PMT array(bar dimension small compared to standoff distance).(10,752 traditional PMTs ETL 9125, immersed in water, surrounded by hexagonal “light-catcher”,transit time spread ~1.5nsec, ~30mm diameter) • DIRC is a 3-D device, measuring: x, y and time of Cherenkov photons,defining qc, fc,tpropagationof photon.
DIRC PERFORMANCE Number of Cherenkov photons per track (di-muons) vs. polar angle: Resolution of Cherenkov angle fit per track (di-muons): s(Dqc) = 2.4 mrad Track Cherenkov angle resolution is within ~10% of design Between 20 and 60 signal photons per track.
DIRC PERFORMANCE D– D0p– K–p + Kaon selection efficiency typically above 95% with mis-ID of 2-10% between 0.8-3GeV/c. (6% comb. background) Kaonselection efficiency forL K>L p (track in DIRC fiducial, comb. background corrected) p mis-id asK
New Development: Focussing DIRC • Red photons arrive before blue photons • Time of Propagation= PathLength/ v group • Correct for Chromatic error from the • mesurement of time of propagation. Ref: NIMA 595(2008)104-107
Energy loss by muons dE/dx : Bethe-Block Formula Ionisation Constant for material Density correction Max energy in single Collision. K=4 p N re2 me c2
dE/dx detectors: Silicon based Bethe-Block formula ( for 2 g m/M << 1 ) Energy loss by ionization For 0.2< b <0.9, dE/dx ~ (M/p)2 M,p= mass, momentum of the traversing particle Ref: NIMA 469(2001) 311-315 FWHM= 30-35 %
dE/dx detectors: Silicon based For minimum ionizing particles in silicon , dE/dx ~ 39 KeV/100 μm An energy deposition of 3.6 eV will produce one e-h pair Hence, in 300 μm we should get a mean of 32k electron-hole (e-h) pairs. The most probable value is ~0.7 of the mean of the landau distribution. Hence we expect to get, 22K e as signal. Typical S/N at LHC = 17/1 In practice the most probable value is estimated from measurements from different silicon layers.
dE/dx Detectors : Silicon based • Each Silicon sensor gives a dE/dX measurement. • Estimate the Most Probable Value from several (10-25) • measurements (Truncated Mean: Ignore upper 40%) CMS Silicon tracker: CMS Silicon strip wafer
dE/dx Detectors: Drift Chambers Larger Landau fluctuations compared to those from Silicon detectors. So many measurements needed to get the average. BABAR Drfit Chamber: Ref: IEEE-TNS VOL:47 , NO:6, Dec2000.
Time of Flight (TOF) Detectors • For a charged particle traversing a detector: using L=v t, b = v/c = p/E = p/ (p2 + m2)0.5 m=mass, p=Momentum, t=time, L= distance travelled, c=speed of light in vacuum. m=p ( (ct/L)2 -1 ) 0.5 Typically, the mass resolution here is dominated by the time resolution , for example when dp/p=1% and dL/L=0.001. For two particles, for p>>m, c Dt = L (m12 - m22 ) / (2 p2 ) At very high momentum, D t will be too small and become comparable to detector resolution; so particle misID shall occur. n =separation in standard deviations = L(m12 - m22 )/(2 p2 c D t ) Typical values: L= 3.5 m, D t=100 ps, for 3 s separation, Pmax = 2.1 GeV/c
Time of Flight (TOF) Detectors • New detectors reach somewhat higher • momentum limit. • Example: LHCb upgrade proposal has • a detector at L=10 m with D t=15 ps, • reaching up to 10 GeV/c for 3s p-K • separation. Ref:NIM A 433 (1999) 542-553
Time of Flight (TOF) Detectors Measurement of time: Using scintillators Energy loss (dE/dx) from the charged particle= 2MeV/cm This energy is re-emitted as optical photons in UV. (Approx 1 photon/100 eV) Too small attenuation length and low yield. Fluorescent material added to scintillator so that the photon re-emitted at longer wavelengths (ex: 400 nm) longer attenuation length ( ex: 1 meter) and high yield . These photons collected by a PMT. (0.002 pe per emitted photon) NA 49: Heavy ion expt, Scintillator thickness=2.3 cm, time resolutions= 59ps, 95 ps Had a TPC to measure dE/dx. Too expensive for large areas.
Time of Flight (TOF) Detectors ALICE at CERN: using MRPC (Multigap Resistive Plate Chamber) Gas detector Resistive plates made of glass. 2 X5 gaps : 250 m m The resistive plates stop the avalanche development. Use HPTDC (High Performance TDC ) Performance in testbeam Time resolution= 50 ps PID in 0.5->2.5 GeV/c
Transition Radiation Detectors (TRD) • Transition Radiation: Radiation in the x-ray region when ultra • relativistic particles cross the boundary • between 2 media with different dielectric constants. • Mainly for e-p separation in 0.5 GeV/c 200 GeV/c. Full explanations and the derivations from Maxwell’s equations: NIMA 326 (1993) 434-469 and references there in. • The radiation is peaked at a small • angle q = 1/g . f q g The intensity of the radiation (after some approximations) becomes where , wi =plasma freq of medium i
Transition Radiation Detectors (TRD) Integrating the previous equation, one can get , for x g =0, Here g = E/m of the particle. This makes PID possible by measuring W. Lighter particle give larger signal W TR = 2.43 x 10 -3wfg wf = plasma frequency = 28.8 (r Z/A)0.5 eV r=density, Z=atomic weight, A=atomic number For example, for w f = 0.02 keV and g =5000, most of the photon energy is in the range 10 keV< w <100 keV (ie. 0.1 w c < w < w c where w c = cut-off frequency ). Number of photons produced= For w c =100 keV and w=1 keV, N= 0.03 for a single surface. Hence to get sufficient number of photons , large number of interfaces are used : a stack of many foils with gaps in between.
Transition Radiation Detectors (TRD) • The minimum thickness of the foils and air gaps are determined by the size of the • ‘formation zone’ and the interference effects. • ( typically foils can be 10-20 mm thick and are made of polypropelene) • Behind a TRD foil stack there is a MWPC or drift chamber where the • TRD signal is detected along with the signal from the charged track. Drift space=10 mm, Anode space=6 mm Drift time=0.51 m s May use FADC or discriminators Example: HELIOS experiment (NA34)
Transition Radiation Detectors (TRD) ATLAS Transition Radiation Tracker Barrel and endcap TRT Bd J/c Ks In an average event, energy deposit from: Ionization loss of charged particles ~ 2.5 keV TR photon > 5 keV. (Photon emission spectrum peaks at 10-30keV) Blue dots: ionizing hits Red dots : TR hits
Cherenkov Detectors in Astro Particle Physics Goal: Contribute to the understanding of our Universe. SNR • Understanding production mechanism (‘cosmic accelerators’) of HE cosmic rays ; • Study very energetic galactic / extragalactic objects : SN remnants, microquasars, GRB, AGN,…; • Search for Dark matter (wimps) • . . . AGN Binary systems GRB Micro-quasars
Astro Particle Physics • Search for : • Neutrinos muons • High energy Gamma and other Cosmic rays Air showers • Ultra high energy Gamma ( > 10 19 eV ) Air showers Neutrinos: Advantages: • Neutral : Hence Weak interaction only • Neutrinos point back to the astrophysical production source • Unlike photons which interact with CMB and matter… • or protons: which also undergo deflection by magnetic fields Disadvantages: • Rate of arrival very low. Hence need very large detectors. • Using the Ocean , ice in Antartica etc.
Typically 1g / PMT • 40 m from m axis o • Measure position • and time of the hits. Angle between the m and n direction= Importance of Timing Resolution c in water ~ 20 cm/ns Chromatic dispersion ~ 2 ns (40 m typ. Path) (PMT TTS s ~1.3ns) so detector not dominant source of error
ANTARES Experiment in the sea. Optical Module Hamamatsu PMT : Size :10 inch Glass pressure Sphere.
IceCube Experiment in Antartica Design Specifications • Fully digital detector concept. • Number of strings – 75 • Number of surface tanks – 160 • Number of DOMs – 4820 • Instrumented volume – 1 km3 • Angular resolution of in-ice array < 1.0° • Fast timing: resolution < 5 ns DOM-to-DOM • Pulse resolution < 10 ns • Optical sens. 330 nm to 500 nm • Dynamic range - 1000 pe / 10 ns - 10,000 pe / 1 us. • Low noise: < 500 Hz background • High gain: O(107) PMT • Charge resolution: P/V > 2 • Low power: 3.75 W • Ability to self-calibrate • Field-programmable HV generated internal to unit. • 10000 psi external
Eµ=10 TeV Ice Cube/AMANDA Event signatures nm from CC interactions All signals from Cherenkov Radiation. nt t m n e from CC or n x from NC interactions ~300m for >PeV t
Knee High Energy Cosmic Ray Spectrum. • Measure the Energy Spectrum • Determine the Arrival Direction distribution etc. • Composed of Baryons, photons, neutrinos etc. >1019 eV 1 km-2 year-1 sr-1
Principle of Auger Project Fluorescence → Array of water → Cherenkov detectors
1600 surface stations • 1.5 km spacing • over 3000 square kilometers • Fluorescence Detectors: • 4 Telescope enclosures, • each with 6 telescopes.
GPS antenna Communications antenna Solar panels Battery box Electronics enclosure Plastic tank with 12 tons of water 3 – nine inch photomultiplier tubes AUGER Project: Water Cherenkov Detector Time difference betweentest signals from nearby detectors ( Carmen-Miranda) • Installation of the Cherenkov detectors are continuing and data taking started. • First set of results are published
Long Base Line Experients: T2K Neutrino production: Protons incident on graphite target to create pions, which decay into m and nm. The muons and and any remaining protons and pions are stopped by a second layer of graphite; but the nm pass through towards SuperK. Beam energy: Centered around 600 MeV (to maximize the oscillation probability into ne ). Far-detector: underground to reduce cosmic rays.
Super-K water cherenkov detector 40 m high, 17 m radius. PMT-schematic
Super-K Cherenkov signals The leptons create Cherenkov light in the water. (muon) (in water) b ~ 1
Super-K signals • Measure the charge and time of • each pulse. From this estimate : • (a) energy of the charged particle. • ( Charge a number photons • a energy loss ) • (b) position (vertex ) of the interaction. • (c ) direction of the charged particle. Muons create sharp rings, Electrons scatter and shower and hence create ‘fuzzy’ rings.
Summary • The particle ID using dE/dx, time-of-flight and Transition Radiation detectors • continue to provide Particle Identification in different experiments. • Particle identification is a crucial part of some of the • Astroparticle physics experiments and long base line neutrino experiments