Download
1 / 16
160 likes | 284 Views
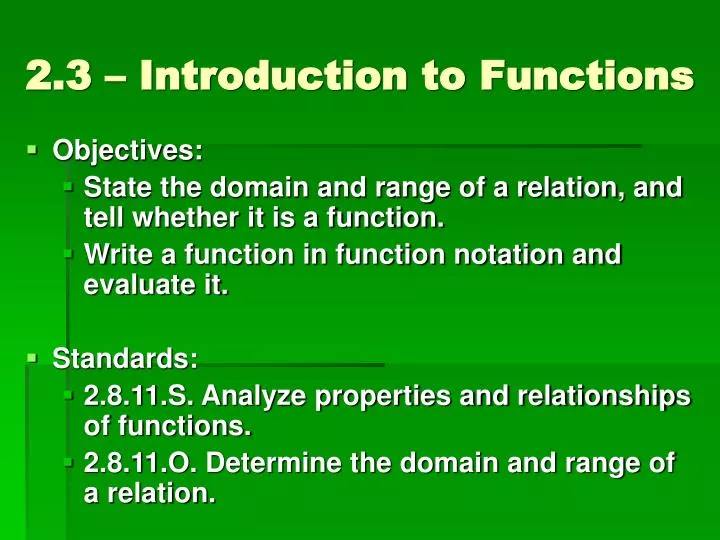
2.3 – Introduction to Functions. Objectives: State the domain and range of a relation, and tell whether it is a function. Write a function in function notation and evaluate it. Standards: 2.8.11.S. Analyze properties and relationships of functions.

E N D
2.3 – Introduction to Functions • Objectives: • State the domain and range of a relation, and tell whether it is a function. • Write a function in function notation and evaluate it. • Standards: • 2.8.11.S. Analyze properties and relationships of functions. • 2.8.11.O. Determine the domain and range of a relation.
Functions and relations are commonly used to represent a variety of real-world relationships. • A function is a relationship between two variables such that each value of the first variable is paired with exactly one value of the second variable. • The domain of a function is the set of all possible values of the first variable. • The range of a function is the set of all possible values of the second variable. • A function may also be represented by data in a table.
Examples: State whether the data in each table represents a function. b). a).
More Examples: Ex. 1d Ex. 1c NO YES
You can use the vertical line test to determine if a graph represents a function. • If every vertical line intersects a given graph at no more than one point, the graph represents a function. b). a).
c). d). Yes, it passes the vertical line test. Any vertical line drawn on this graph hits only 1 point. No, it does not pass the vertical line test. The middle segment hits the vertical line at an infinite number of points.
III. A function is a special type of relation. A relationship between two variables such that each value of the first variable is paired with one or more values of the second variable is called a relation. Ex 4. b. D: {-4, -3, -1, 2, 3, 5} R: {-3, 0, 1, 2}
State the domain and range of eachgraphed. c. d. D: x ≥ -2 R: y ≥ -1
Functions and Function Notation • y = 2x + 5 → f (x) = 2x + 5 If there is a correspondence between the domain and range that is a function, then y = f(x), and (x, y) can be written as (x, f(x)) The number represented by f(x) is the value of the function f at x. • The variable x is called theindependent variable. • The variable y, or f(x), is called thedependent variable.
Example 2 • Monthly residential electric charges, c, are determined by adding a fixed fee of $6.00 to the product of the amount of electricity consumed each month, x, in kilowatt-hours and a rate factor of 0.35 cents per kilowatt-hour. • Write a linear function to model the monthly electric charge, c, as a function of the amount of electricity consumed each month, x. • If a household uses 712 kilowatt-hours of electricity in a given month, how much is the monthly electric charge? b. C(712) = 0.35 (712) + 6 C(712) = $255.20 • C(x) = 0.35x + 6
Example 3 • A gift shop sells a specialty fruit-and-nut mix at a cost of $2.99 per pound. During the holiday season, you can buy as much of the mix as you like and have it packaged in a decorative tin that costs $4.95. • a. Write a linear function to model the total cost in dollars, c, of the tin containing the fruit-and-nut mix as a function of the number of pounds of the mix, n. • b. Find the total cost of a tin that contains 1.5 pounds of the mix. • C(n) = 2.99n + 4.95 • C(1.5) = 2.99(1.5) + 4.95 • C(1.5) = $9.44
Writing Activities: • 3a. Describe several different ways to represent a function. Include examples. • 3b. Give the domain and range for each of your functions in part a.
Writing Activities: • 4. Give an example of a real-life relation that is not a function.
Standard 2.8.11 O Determine the domain and range of a relation A relation can be represented in several ways such as a set of ordered pairs or a graph. How can you identify the domain and the range of a relation? 1). Consider the relation below: {(-2, 7), (-1,5) (-1, 4) (2,3) (3,3) (5,0)} 2). Each graph below shows a relation. Identify the domain and range of each relation.