Download
1 / 51
510 likes | 650 Views
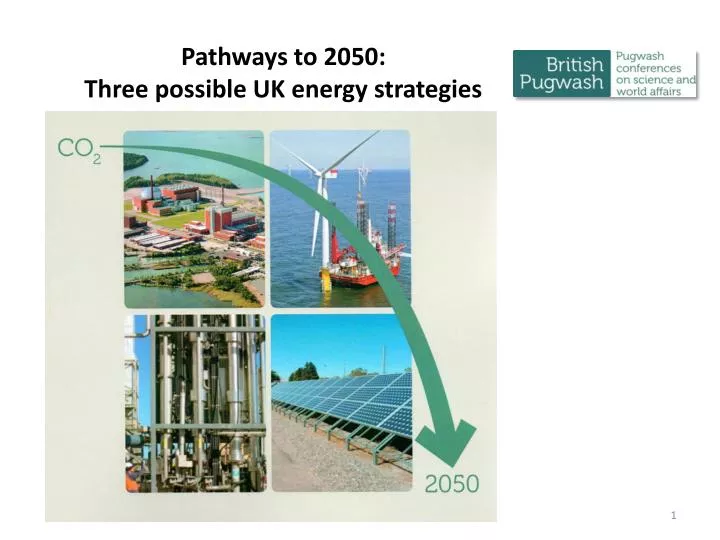
Pathways to 2050: Three possible UK energy strategies. Pathways to 2050: Three possible UK energy strategies Report of a British Pugwash Working Group. Presentation at University College, London 14 February 2013 by: Dr Christopher Watson – convenor of the Working Group and general editor

E N D
Pathways to 2050: Three possible UK energy strategies
Pathways to 2050: Three possible UK energy strategiesReport of a British Pugwash Working Group Presentationat University College, London 14 February 2013 by: Dr Christopher Watson – convenor of the Working Group and general editor Dr Christine Brown – champion of the ‘High Nuclear’ Pathway Prof David Elliott and Dr David Finney – co-champions of the ‘High Renewables’ Pathway Dr Ian Crossland – champion of the ‘Intermediate’ Pathway
Summary • Introductions and acknowledgements • Objectives of this British Pugwash project • UK Government energy planning 1998-2012 • The current UK energy supply system • Why does the UK energy system need to change? • Technologies to be considered for future developments • The DECC ‘Pathways to 2050 Calculator’ • Presentations by the three champions: • The High Nuclear Pathway • The High Renewables Pathway • The Intermediate Pathway • A comparison of the three Pathways • Issues to take into account in reaching a decision • Conclusions and recommendations
Acknowledgements We are very grateful to • All the members of the British Pugwash Working Group • Our reviewers, most of whose comments have been incorporated in the final text. • Sarah Graham-Brown for all her work in preparing the manuscript for publication. • The Network for Social Change for a grant to support the cost of printing and distributing this report.
Objectivesof this British Pugwash project • To promote a meaningful public debate about UK energy policy, based on realistic alternatives. • To present three ‘possible’ Pathways to 2050, which all meet the UK’s international commitments on GHG emissions, and identify the prospects and risks associated with each. Here ‘possible’ means based on technologies which have either: • already reached commercial maturity, or • can be expected to do so in time to be rolled out as planned by 2050. • To emphasise the need for strong government leadership, taking rapid decisions on energy policy. Leaving it all to ‘the market’ is not a realistic option, given the urgency of the task. • To avoid being distracted by the uncertainties in climate change modelling.
UK government energy planning 1998-2012 Our report gives a detailed account of the evolution of UK energy policy since 1998. In brief, there have been four phases: • 1998-2006 (Tony Blair) early moves towards creating a low-carbon economy, by cutting the UK’s CO2 emissions, and possibly some private sector nuclear ‘new build’. • 2007-2008 Gordon Brown supports inclusion of nuclear power alongside other low-carbon technologies. However a Nuclear Power White Paper recognises that there are still public concerns about this. • 2008-2009 The Climate Change Act is passed , which commits the UK to a cut of at least 80% in GHG emissions by 2050, and a reduction of at least 26% by 2020, both against a 1990 baseline, with periodic reports to Parliament on progress. • 2009-2012.The government announces an intention to go ahead with 16 GW of ‘new build’ nuclear power stations, and to give support to the development of CCS. DECC publishes its ‘Pathways to 2050 Calculator’ (of which more later), and a ‘Low Carbon Transition Plan’ (not really a plan) • November 2012 Edward Davey publishes the 2012 Energy Bill, designed to create an ‘Electricity Market’, to help the private sector take investment decisions.
The current UK energy supply system • The current UK energy system produces some 300 GW of ‘primary’ energy. Of this • about 105 GW is used to generate ~37 GW of electricity supplied to end users, • non-electric end use is for heating (~53 GW), transport (~78 GW)& industrial processes (~44 GW) • some 90 GW of primary energy is lost in the process of converting it into usable form. • The primary energy used to generate electricity comes predominantly from: • gas 46%, coal 29%, and nuclear 16%, • all other sources together contribute about 10%. • The end use of electricity is divided between: • domestic consumption 12 GW (heating, cooling, lighting & appliances), • industrial use 12 GW (predominantly metallurgical & heavy engineering), • public and commercial consumption 12 GW • Demand for electrical energy is subject to strong seasonal and diurnal variations – from 20 GW in a hot summer to 60 GW in a cold winter, and by a factor of 60-70% during the course of a typical day. There are also exceptional demand variations (eg a Cup Final or an eclipse of the sun). There are similar variations in the (four times larger) gas demand. • Balancing supply with the demand for both electricity and gas is the responsibility of the National Grid Company, and is managed by special supply contracts and by drawing on energy storage (eg at Dinorwig) and interconnects.
Why does the UK energy system need to change? • Its fossil fuel component generates an unacceptable amount of CO2. Capturing & storing this CO2 is a possible solution to this problem, but this technology has still to be proven commercially, so it is risky. • Our nuclear reactor fleet, which now generates 70% of our low-carbon electricity, is obsolescent. 14 reactors have already been shut down: all but three of the remaining 16 are due to close by 2025. • Our indigenous oil & gas reserves are declining: we already import ~40% of our gas and by 2025 DECC foresees that 70% of our oil and gas could be imported. This would make us uncomfortably dependent on potentially unstable countries. • The UK is currently lagging behind several advanced economies in exploiting its potentially rich renewable energy resources Conclusion: We anticipate that the UK will have to re-build its energy supply infrastructure almost completely during the next 40 years, at a cost of about £3 trillion. This is a heroic, but not utterly unrealistic task.
Technologies to be considered for future developments • Improved energy efficiency in the home, industry & commerce • 3rd Generation Nuclear Technology - possible candidates are: • EPR (the European PWR developed by Areva, being built in Finland etc) • AP1000 (the Westinghouse PWR now being built in the US & China) • ABWR (the GE-Hitachi BWR being operated in Japan and built in China) We have rejected as unrealistic the option of leapfrogging to a 4th Generation reactor • Wind energy – possible candidates are onshore and offshore • Solar energy – possible candidates are PV and solar thermal • Bioenergy – this class includes energy crops & agricultural wastes • Wave , tidal stream, tidal range, hydro and geothermal energy • Carbon Capture and Storage (CCS) – there are several variants
The DECC ‘Pathways to 2050 Calculator’ • This software tool has been used extensively in our work. Made publicly available by DECC in 2010, it enables the user to develop an energy strategy for the UK, and compute its key parameters, including capacities, emissions & costs • Our report explains how we have used it, and identifies a few of its weaknesses. It incorporates a lot of relevant DECC data. • Outputs from the Calculator include graphics, reproduced on pp130-136 of our report. Especially useful is the ‘Sankey diagram’ (next slide), showing the energy flows through the system, and demonstrating energy conservation. • The Calculator requires the user to set 43 parameters, half of which influence energy demand, and half the system’s supply mix. • The Calculator shows that all three British Pugwash Pathways achieve an 80% reduction in GHG emissions by 2050 • All three Pathways also pass its ‘intermittency stress test’
The High Nuclear Pathway Presentation by Christine Brown
HIGH NUCLEAR PATHWAYOBJECTIVES • Meet GHG emission targets by 2050 • Provide Clean Energy • Provide security of supply • Limit reliance on CCS to reduce GHG emissions • Realistic approach to reducing energy demand • Concentrate effort on proven technology and rebuild skills • Credible • Safe and reliable • Economically viable • Political and Public acceptable • Compatible with UK’s non-proliferation commitments
HIGH NUCLEAR PATHWAYEnergy Demand TOTAL ENERGY DEMAND FALLS BY 19% BY 2050
High Nuclear PathwayElectricity Demand TOTAL ELECTRICITY DEMAND INCREASES BY 71%
High Nuclear PathwayElectricity Supply Breakdown Cf. TOTAL ELECTRICITY DEMAND IN 2050 of 68.6GWav
HIGH NUCLEAR PATHWAYNew Build EPR Under Construction Olkilouto, Finland 2nd under construction at Flamanville ABWR under Construction Lungmen, Taiwan 4 ABWR units in operation 4 ABWR under construction
HIGH NUCLEAR PATHWAYSpent Fuel Management (1) Thermal reactor fuel has a useful life of 3 to 7 years. After discharge it remains radioactive and produces significant heat Initially cooled under water in storage ponds next to reactor After 9 -12 months cooling requirements drop and alternative management options can be considered depending on fuel cycle chosen • Open - spent fuel disposed of directly in a GDF • Closed - spent fuel recycled to generate more energy
HIGH NUCLEAR PATHWAYFuel Cycle SUSTAINABLE USE OF RESOURCES Source: US DOE Energy Information Administration International Energy Outlook 2004, DOE/EIA-0484(2004). Note: Gas and Oil include speculative reserves; Coal and Uranium do not.
HIGH NUCLEAR PATHWAYSpent Fuel Management (2) “In the rush to construct nuclear reactors, the management of spent fuel and radioactive waste, including planning for its disposal, must no longer be an afterthought.” “Spent fuel should be reprocessed only when there is a clear plan for its re-use.” If nuclear power is part of the government’s energy policy then “this policy should specify the requirements for managing spent fuel and radioactive wastes, including sufficient capacity for interim storage, as well as initiating plans for delivering timely geological disposal from the outset” Ref. “Fuel Cycle Stewardship in a Nuclear Renaissance” – The Royal Society Science Policy Centre Report October 2011.
HIGH NUCLEAR PATHWAYCONCLUSIONS • Delivers energy security with the required 80% reduction in GHG emissions by 2050 • The clock is ticking fast – UK needs to act now • Nuclear power has the potential to ensure energy security for years beyond 2050 but requires proper management of spent fuel • Requires 27 3GWe reactors to be built within the next 40 years – history supports such a build rate • The technology exists and is tried and tested Can we afford to ignore this clean, secure source?
The High Renewables Pathway Presentation by: Prof. David Elliott (The Open University) Dr David Finney
10 countries get nearly 100% of electricity supplied by renewables, mostly from hydro: Albania, Angola, Bhutan, Burundi, Costa Rica, D R Congo, Lesotho, Mozambique, Nepal, Paraguay, Tajikistan and Zambia A further 30 developing countries obtain 60-90% of their electricity from renewables, again mostly hydro Hydro provides nearly all the electricity in Norway, most of it in Iceland, up to 60% in Austria, Canada, New Zealand and Sweden. Two countries are aiming to get 100% of total energy from renewables by 2050: Denmark, New Zealand Germany is aiming for 80% of electricity by 2050 Severalcountries in the EU are Non-nuclear:Austria, Denmark, Italy, Ireland, Portugal, Greece, and soon Germany and Belgium.
Tidal Wind Solar Hydro 1kW PV array Mini hydro-MW 2MW turbines in an offshore wind farm Macro hydro-GW Tidal 2MW unit Wave Biomass CSP
Two recent Electricity scenarios Electricity WWF proposal for 2030 Poyry proposal for 2050 Generating Installed Output Installed Output Option GWn GW av GWn GW av TWh Offshore wind 52 19 156 57 501 On-shore wind 20 4 33 7 61 Photovoltaics10 1 38 3 27 Tidal stream/ wave/hydro 12 3 31 7 63 Biomass,other Geothermal 10 3 6 1.5 13 Total Renewables 104 30 264 75.5 665
Our chosen scenario for 2050(The DECC Calculator forces retention of some fossil fuels) Energy source Installed Capacity Output Comment GWn GW av Offshore wind 76 34 Half of Poyry On-shore wind 31 9 Solar (PV & thermal) 41 9 Tidal stream/wave/hydro 35 10 Environmental heat 7 7 Biomass & waste 38 38 Geothermal 4 3 Total Renewables 232 110 Non-renewable 51 51 Still some fossil fuel Total energy produced 283161Includes a lot of exports
Energy demand cut by 40% by 2050 EU target is a 20% cut by 2020DECC says 40% savings are possible in key UK sectors by 2030, including industry Germany is aiming to cut primary energy use by 50% by 2050The Environmental Change Institute says that the 54 GW of gas and oil and 23 GW of electricity now consumed in the building sector could be cut to 11 GW of renewable electricity supplied by the grid by 2050. Carbon emissions from this sector would then be zero
Gas Coal
Pugwash High Renewables- DECC calculator Excess wind generation exported via 15GW inter-connector
DECC Sankey diagram for High Renewables The DECC software won’t let us replace all the fossil fuel with renewables. We wanted to use some of the excess electricity from wind generation to make hydrogen for use in backup plants rather than fossil fuel. The DECC Calculator simply exports it all. Note the very low losses
Marine inputs Our choice is well within the potential resource of UK offshore wind, wave, tidal, amounting to 531 GW (466 GW wind, 33GW tidal stream, 18GW wave, 14GW tidal range) Nova Sway ‘Offshore Valuation’, Public Interest Research Centre www.offshorevaluation.org/
Combined Heat and Power/District HeatingThe Royal Academy of Engineering commented that ‘Larger district systems, incorporating a CHP facility and providing heating are significantly more efficient than domestic level installations.Central systems may be more efficient and are likely to offer much greater energy storage than do systems designed for individual household’. ‘Heat: degrees of comfort?’ Royal Academy of Engineering, 2012, www.raeng.org.uk/heat
District HeatingAround 60% of Denmark’s domestic/commercial heat is supplied by DH. Some fossil fired, some also fired by biomass. By 2050 it wants 40% of this to be solar fed, with inter-seasonal heat stores. DH can also be fed by largeheat pumps.About 60% of the total energy input for Stockholm’s Central Heat Network is provided by six l180 MW heat pumps, total heat supply capacity 420 MW(th). Helsinki in Finland has 90MW heat pump plant, feeding its district heating network. The network supplies over 93% of Helsinki’s heat.
Biomass wood chip for combustionSources-energy crops (SRC), forestry wastes.Biogas from AnaerobicDigestion-biomethane Sources: Farm wastes, land fill gas, sewage gas,food waste
Land use10% of UK land area used for energy cropse.g. fast growing non-food Short Rotation Coppice72% of UK land is used for agricultural purposes (forestry excluded). Changes in farming practice and perhaps changes in diet would be needed.But no biomass would be imported
Pugwash High Renewable Scenario summary of results • The scenario balances total energy supply and demand using renewables for nearly all needs, with no biomass imports • Even when variable renewables are low, supply meets demand with no need for fossil back up • It is cheaper than the Pugwash High Nuclear and Intermediate scenarios and reduces emissions more • Cumulative emissions are 12% less than High Nuclear and 14% less than Intermediate scenarios • The net income from electricity exports set against imports would earn the UK £15.6 billion p.a. • With the wind-to-gas backup option, it could be 100% renewable
The Intermediate Pathway Presentation by Dr Ian Crossland
Aims of the Intermediate Pathway • 80% reduction in GHG emissions on 1990 levels by: • Reduction in demand • Electrification of supply coupled with low carbon electricity generators • High level of achievability • Mixture of high output sources - general rejection of small output sources especially where they need a lot of development (PV, geothermal, small scale wind etc) • More ambition with respect to energy demand than supply • Standby generation ≤10% of total capacity
Reduction in demand at 2050 • Demand at 2050 reduced by 21.5% on 2010 as a result of four “very ambitious” (i.e. Level 3) choices: • Reduction in demand comes primarily from • Transport -31% • Industry -33%
Intermediate pathwayBalance of primary supply 2010 2050 Blue – fossil fuels Red – nuclear Green - renewables
Intermediate pathwayConclusions • A roughly equal combination of CCS, nuclear and renewables enables the 80% reduction in GHG emissions to be met. Pathway is broadly similar to NGC, Markal • Some “very ambitious” targets for energy savings but no heroic assumptions • An essential element is the use of biofuels with CCS to produce “negative” emissions. Without this, the 80% reduction cannot be met
A comparison of the three PathwaysHigh Nuclear (HN), High Renewables (HR) and Intermediate (Int) • All three Pathways achieve some reduction in end-user demand by 2050 (HN and Int ~20%, HR ~40%). Larger reductions are controversial. • All three approximately double the electrical energy supplied, because of end-use electrification, but the HR capacity is much higher, so as to give a reserve to cope with renewables intermittency • Two of the three Pathways expand the Nuclear fleet beyond the immediate ‘new build’ scale (HN 80 GWe, Int 39 GWe). The third eliminates it altogether. • All three Pathways include some renewable energy capacity, but the amounts vary greatly (HN 18 GW, Int 40 GW, HR 181 GW) • All three include some CCS (HR 2 GW, HN 21 GW, Int 51 GW) • All three achieve the 80% reduction in emissions by 2050: the HR Pathway achieves reductions earlier, because it has no nuclear build • All three Pathways are estimated to cost £3 trillion over the period 2010-2050. The differences between them are less than the uncertainties.
Issues to take into account in reaching a decision • Technical risk: • Nuclear – none of the 3rd generation designs under consideration is yet fully proven • Renewables – apart from onshore wind, none of the technologies are yet fully commercially competitive, and onshore wind has land use and public acceptability issues • CCS – there is as yet no full-scale commercial plant anywhere in the world, and there are uncertainties about its cost and infrastructure requirements • Commercial risk: trends in the cost of all the relevant technologies are hard to predict • UK industrial infrastructure: we have lost much of our historic nuclear capability, and have not yet created a capability for rapid manufacture of renewable or CCS technology on the required scale
Issues to take into account in reaching a decisioncontinued • Safety issues: a major nuclear disaster has occurred somewhere in the world about once every decade. There is also ongoing public concern about radioactive waste disposal. • Environmental issues: biocrop and onshore wind make high demands on UK land (10% and 1% respectively of the UK land area for the High Renewables Pathway). Extensive industrial activity on upland peat areas would threaten its ability to sequester CO2. • Nuclear non-proliferation commitments: the UK has a special position as a Nuclear Weapon state • International trade: the UK needs to position itself to benefit from the new energy market • Public opinion and national politics: recent polls have sent ambiguous signals about public preferences and concerns, and there is as yet no cross-party political consensus about the right way forward. The only universal message seems to be ‘not in my back yard’.