Download
1 / 23
230 likes | 233 Views
This research examines the impact of perceptions of corruption on intentional non-compliance behavior among personal income taxpayers in Indonesia. The findings provide policy implications for developing economies.

E N D
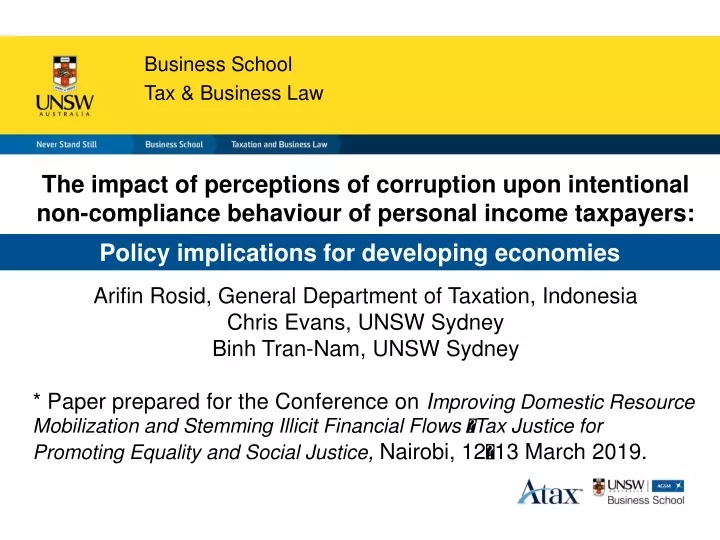
Business School Tax & Business Law The impact of perceptions of corruption upon intentional non-compliance behaviour of personal income taxpayers: Arifin Rosid, General Department of Taxation, Indonesia Chris Evans, UNSW Sydney Binh Tran-Nam, UNSW Sydney * Paper prepared for the Conference on Improving Domestic Resource Mobilization and Stemming Illicit Financial Flows Tax Justice for Promoting Equality and Social Justice, Nairobi, 1213 March 2019. Policy implications for developing economies
Overview: • Background • Research design • Findings • Discussion • Conclusion
Problems for conducting business in Indonesia, 2016 Note: Surveyed respondents were required to indicate the five most problematic factors for doing business in their country and to rank them between 1 (most problematic) and 5 (least problematic). Scores correspond to the number of responses weighted according to their rank Source: World Economic Forum (2016)
The Indonesian ‘tax ratio’ is lower than those of most low income countries Tax ratio by per-capita GNI category, 19912006 Source: Adapted from (IMF 2011, pp. 60-62)
Level of perceived corruption correlates with tax ratio Share of tax revenue in GDP and perceived corruption Source: Author’s calculation on 119 countries data of the CPI 2012 data (Transparency International, 2013) and the World Bank data of tax revenue as percentage of GDP (World Bank, 2013).
A strong need to understand operating contexts Influences on tax compliance outcomes Source: OECD (2014, p. 15)
Primary empirical question of the research Do (and how) perceptions of corruption cause intentional non-compliance behaviour in personal income taxpayers?
Conceptual boundaries (1) 5 types of perceived corruption Based on the actors and the sectors involved
Conceptual boundaries (2) ? 2 types of deliberate action The ‘intention-action divide’ phenomenon (World Bank, 2015) Tax compliance is an ex-post definition
Mixed methodology—’qualQUANT’ • In-depth interviews • 9 participant (3 tax agents, 3 taxpayers, 3 tax officers) • Mixed-modes survey • 12 tax offices across 4 regions • 397 respondents (201 employed & 196 self-employed taxpayers)
N = 9 First phase—interview results (thematic analysis) Diagrammatic interpretation of qualitative findings A hypothetical model of relationships between high levels of perceived corruption with low levels of compliance behaviour was developed and further investigated in the quantitative phase.
N = 397 Second phase—survey results (structural equation modeling) general corruption (PGC) $ Model A grand corruption (GCO) 3 types of (perceived) corruption were significantly influential Most influential = grand corruption grand tax corruption (GTC) Model B Taxpayers appear to be ‘evasion-minded’ rather than ‘compliance-minded’ Model C Number of models examined = 6
Understanding a spectrum of taxpayers attitude to compliance Source: modified from OECD (2004, p. 41) Operating context
Compliance risk management (CRM) Source: OECD (2010, p. 9). CRM has now a stronger focus on understanding and influencing taxpayer behaviour (Alink & Kommer, 2016)
CRM process is a mean score for perceptions of grand corruption (out of 7) 6.49 Self-employed PITs correctly reported actual income 18% Self-employed PITs underreported between 50%-100% of their actual income 44%
Compliance behaviour analysis What is occurring? Intentional underreporting income is evident among Indonesian PITs. Who is doing it? Self-employed PITs appear to be more non-compliant simply because they have much higher perceived behavioural control over tax underreporting. Why are they doing it? Perceptions of grand corruption, grand tax-corruption and general corruption appear to be responsible for intentional tax underreporting behaviour. Searching for causes
Appendix 1 Designing treatment strategies (analytical hierarchy process) A combined approach to address the adverse impact of perceptions of corruption upon intentional non-compliance behaviour: A tax authority perspective Appendix 2
Conclusion • Environmental scanning is crucial. This research shows that perceptions of certain forms of corruption can have a malign impact upon tax compliance through a variety of forces and relationships. • The extent of high perceived levels of different forms of corruption and its impact upon intentional tax underreporting behaviour in Indonesia are confirmed in both qualitative and quantitative approaches. • Well-informed analysis and a whole-of-government approachare needed to systematically address this endemic issue. • ‘Norm-based intervention’ and ‘segmented-enforcement’ approaches need to be considered in the context of the wider vision of achieving long terms goals, but with caution.
Publications derived from the research: Arifin Rosid, Chris Evans and Binh Tran-Nam (2016): Do Perceptions of Corruption Influence Personal Income Taxpayer Reporting Behaviour? Evidence from Indonesia’, eJournal of Tax Research 14(2): 387425. Thank you Arifin Rosid, Chris Evans and Binh Tran-Nam (2018): Perceptions of Corruption and Tax Non-compliance Behaviour: Policy Implications for Developing Countries, Bulletin of Indonesian Economic Studies 54(1): 136.
Appendix 1 Treatment strategies (1) TAX
Appendix 2 Treatment strategies (2) Segmentation & rotation of special audit projects TAX
Appendix 3 Focused enforcement in detail Segmentation & rotation of special audit projects Special audit projects >10% chance of being audited TAX < 1% chance of being audited Increasing penalties may not have a noticeable effect on compliance, unless the probability of detection is increased significantly (Gneezy & Rustichini, 2000). Uncertainty aversion Probability neglect Availability bias