Download
1 / 90
900 likes | 915 Views
Surface & Groundwater Pollution In Developing Nations. Introduction. Surface & Groundwater. The Hydrologic Cycle. Water Basics Sea water 97.2% Fresh Water 2.8% Polar ice & glaciers 2.15% Groundwater 0.62% Lakes and Rivers 0.01%. The Hydrologic Cycle.

E N D
Introduction Surface & Groundwater
The Hydrologic Cycle • Water Basics • Sea water 97.2% • Fresh Water 2.8% • Polar ice & glaciers 2.15% • Groundwater 0.62% • Lakes and Rivers 0.01%
The Hydrologic Cycle • The Three Fates of Precipitation • Infiltration • The movement of water into rocks or soil through cracks and pore spaces • Runoff • Water that flows over the land • Transpiration/Evapotranspiration • the release of water vapor to the atmosphere by plants
The Hydrologic Cycle • Infiltration capacity of the soil is controlled by: • Intensity and duration of rainfall • Soil saturation • Soil texture • Slope of the land • Nature of the vegetative cover
Main Sources of Water • Surface Water • Lakes, rivers, reservoirs • Ground Water • In the Earth, flows through fractures and pores
Surface Water – Stream Valleys • Flood Plains • Periodic floods deposit rich soils • Agricultural production on floods plains is followed by urbanization • Natural levees • Forms as floods deposit coarse detritus near the river • Naturally constraint the river except in the larger floods
Surface Water – Flooding • Floods and flood control • Floods are the most common geologic hazard • Causes of floods • Weather • Human interference with the stream system
Surface Water – Flooding • Floods and flood control • Engineering efforts • Artificial levees • Flood-control dams • Channelization • Nonstructural approach through sound floodplain management
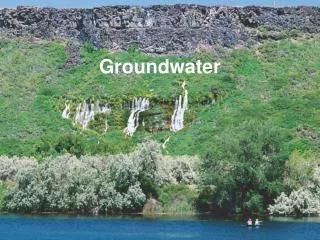
What is Groundwater? • Water found in the pores and fractures of soil and bedrock • Largest reservoir of fresh water • Tends to be less polluted than surface water
What is Groundwater? • An important erosional agent • Groundwater is often mildly acidic • Contains weak carbonic acid • Forms caverns at or just below the zone of saturation • Karst topography on the surface
Groundwater Movement & Storage • Factors • Porosity • Percentage of total volume of rock or sediment that consists of pore spaces • Determines how much groundwater can be stored • Variations can be considerable over short distances • Permeability • The ability of a material to transmit a fluid
Groundwater Movement & Storage • Factors (continued) • Specific retention • The portion whish is retained as a film on particles, rock surfaces, and pore spaces • Specific yield • The portion which will drain under gravity • In general, • Porosity = Specific retention + Specific yield
Groundwater Movement & Storage • Factors (continued) • Aquifer - A zone of Earth material capable of supplying groundwater at a useful rate from a well
Groundwater Movement & Storage • Factors (continued) • Aquitard - A zone of Earth material that holds water but cannot transmit it fast enough to pump from a well
Getting Groundwater Out of the Ground • Extraction Methods • “Natural” Methods • Springs, Hot Springs, & Geysers
Getting Groundwater Out of the Ground • Extraction Methods (continued) • Man-made Methods • Wells
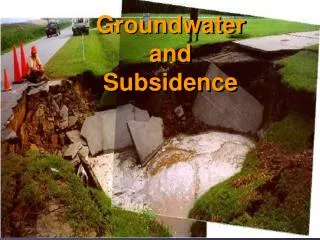
Getting Groundwater Out of the Ground • Problems with groundwater removal • Non-renewable resource • Subsidence • Contamination
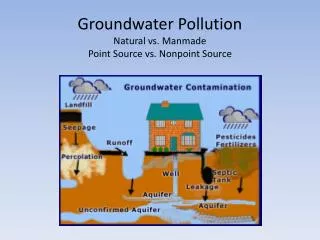
Sources of Contamination • Natural Sources • Biologic activity / organisms • Naturally occurring elements • Human Caused • Acid Rain • Agricultural / Industrial Run-off
Sources of Contamination • Natural Sources • Bacteria and viruses • Uranium, radium, arsenic, and fluoride • Often naturally occurring in rock formations
Sources of Contamination • Human Caused • Acid Rain • Acid rain is caused by: • CO2 from cars and power plants • NOx from cars • SO2 from power plants
Sources of Contamination • Human Caused • Agricultural / Industrial Run-off • Leakage from waste disposal, treatment, or storage sites. • Discharges from factories, industrial sites, or sewage treatment facilities. • Leaching from pesticides and fertilizers on yards or fields.
Sources of Contamination • Human Caused • Agricultural / Industrial Run-off • Accidental chemical spills. • Leakage from underground storage tanks. • Improper disposal of household wastes such as cleaning fluids, paint, and motor oil.
Population & Water Resources • Urban population • The average size of the world's 100 largest cities • ~0.2 million in 1800 • ~0.7 million in 1900 • ~6.2 million in 2000. Source: UNESCO
More developed regions: 70.0% in 1975 75.5% in 2000 78.5% in 2015 Less developed regions: 27.0% in 1975 40.5% in 2000 48.5% in 2015 Population & Water Resources Proportion of the population living in urban settlements: Source: UNESCO
Urban water supply and sanitation • Proportion of households in major cities connected to piped water: • World: 94% • Africa: 43% • Asia: 77% • Europe: 92% • Latin America / Caribbean: 77% • North America: 100% • Oceania: 73% Source: UNESCO
Urban water supply and sanitation • Proportion of households in major cities connected to sewers: • World: 86% • Africa: 18% • Asia: 45% • Europe: 92% • Latin America / Caribbean: 35% • North America: 96% • Oceania: 15% Source: UNESCO
Urban water supply and sanitation • Urban child mortality • In the urban areas of low-income countries, 1 child in 6 dies before the age of five. • In areas poorly served with water and sanitation, the child mortality rate is multiplied by 10 or 20 compared to areas with adequate water and sanitation services. Source: UNESCO
Urban water supply and sanitation • Toilets and latrines • Infectious diseases transmitted by human excreta: • cholera, • typhoid, • infectious hepatitis, • polio, • cryptosporidiosis, • and ascariasis Source: Worldwaterday.org
Urban water supply and sanitation • Toilets and latrines • Uganda Ministry of Health study • 1995 – One toilet for every 328 students • 2001 – One toilet for every 700 students • Attributed to increased enrollment in schools • 33% of 8000 schools had separate latrines for girls Source: Worldwaterday.org
Urban water supply and sanitation • Toilets and latrines • Prevention / control • Low population density areas • On-site systems such as ventilated improved pit (VIP) latrines, double vault composting latrines, pour-flush toilets, and septic tanks. Desludging latrine pits in slum areas is not easy. This specially designed 'Vacutug' is doing good work in Kibera, Nairobi (Picture: IRC/Madeleen Wegelin ) Source: Worldwaterday.org
Urban water supply and sanitation • Toilets and latrines • Prevention / control • High population density areas • Off-site sewage treatment plants • Sewer systems • Requires adequate infrastructure • Low-tech waste stabilization ponds also a low-cost option Source: Worldwaterday.org
Water and health • Diarrheal diseases • 6,000 deaths per day • mostly among children under five. • How to prevent? • WASH YOUR HANDS! Some children wash their hands in a bucket, demonstrating safe hygiene. Source UNICEF wwap@unesco.org Source: UNESCO
Water and health • Malaria • Over 1 million people die from malaria every year. • About 90 percent of the annual global rate of deaths from malaria occur in Africa south of the Sahara. • How to prevent? • Sleep under mosquito nets Source: UNESCO
Water and health • Schistosomiasis (worms) • More than 200 million people worldwide are infected by schistosomiasis. • 88 million children under fifteen years are infected each year with schistosomes. • 80 percent of transmission takes place in Africa south of the Sahara. Source: UNESCO
Water pollutants from industry • Some 300-500 million tons of heavy metals, solvents, toxic sludge, and other wastes accumulate each year from industry. • In developing countries, 70% of industrial wastes are dumped untreated into waters where they pollute the usable water supply. Source: UNESCO
Pressures on freshwater ecosystems • Main threats to ecosystems from human activities • Population and consumption growth. • Infrastructure development • Land conversion • Overharvesting and overexploitation • Release of pollutants • Introduction of exotic species Source: UNESCO
Pressures on freshwater ecosystems • River pollution • Every day, 2 million tons of human waste are disposed of in water courses. • 40% of water bodies assessed in 1998 in the United States were not deemed fit for World distribution of hydropower recreational use due to nutrient, metal and agricultural pollution. Source: UNESCO
Pressures on freshwater ecosystems • River pollution • 5 out of 55 rivers in Europe are considered pristine • In Asia, all rivers running through cities are badly polluted. Source: UNESCO
Pressures on freshwater ecosystems • Wetlands loss: • 50% of the world's wetlands have been lost since 1900. • More than 80% of the wetlands along the Danube River have been destroyed since the start of the 20th century. • The Mesopotamian Marshlands in the Tigris and Euphrates river basins were devastated by damming and river channelization. Source: UNESCO
Pressures on freshwater ecosystems • Biodiversity loss: • Between 34 and 80 fish species have become extinct since the late 19th century, 6 since 1970. • At a global level, around 24% of mammals and 12% of birds are classified as threatened. • In the United States, 120 of 822 freshwater fish species are considered threatened, representing 15% of total fish species. Source: UNESCO
Sharing Water Resources • Conflict and cooperation • There have been 1,831 interactions (both conflictual and cooperative) over the last fifty years. • The concept of 'virtual water' has been developed which allows nations and states to share the products and benefits. Source: UNESCO
Case Studies Gujarat, India Bangkok, Thailand Aral Sea
Gujarat, India • Physiography • Salt deserts in Kachchh • Wet & fertile in SE • 2/3 of population engaged in agriculture
Gujarat, India • Water Sources: • Three perennial rivers flowing through South Gujarat • One major non-perennial river flowing in the central NW portion of the state • Rainfall is erratic
Gujarat, India • Area is susceptible to drought • Exacerbated by: • rocky terrain, • desert region, • a 1600 Km long coastline • and deteriorating ground water quality.