Download
1 / 10
100 likes | 236 Views
Research on 3-D Dynamic Indoor Radio Propagation Models. Robert Player Yiming Ji Department of Science and Mathematics. Research Statement To study a dynamic 3-D indoor radio propagation model using an efficient ray-tracing method . Objectives

E N D
Research on 3-D Dynamic Indoor Radio Propagation Models Robert Player Yiming Ji Department of Science and Mathematics
Research Statement To study a dynamic 3-D indoor radio propagation model using an efficient ray-tracing method. Objectives Develop an effective ray-tracing technique in 3-D environments. Conduct signal strength measurements in different building environments. Develop a 3-D radio propagation model and evaluate the model’s signal predictions using signal measurements from various building environment measurements. Where P is the power of the radio at the receiver, P0 is the power at the transmitter, r is the reflection coefficient, and tr is the transmission coefficient through participations like walls and floors.
Note: The angle of incidence equals angle of reflection Getting Started Approaches Legend R - number of reflection P - number of paths *for 2-D, P = 4(R) (xi, yi) - transmitting point (x, y) - receiving point xp - x perimeter yp - y perimeter - reflection of (x, y) • Understand the nature of ray reflection from transmitter to receiver • Begin work in a 2-D environment • Apply basic principles learned from 2-D to a 3-D environment
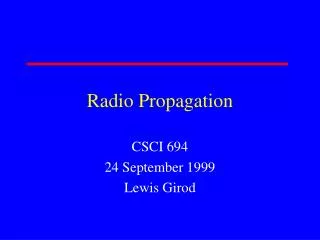
Examples in 2-D • Note the diamond pattern the corresponding reflection numbers make around the ‘room’ The integer inside each square is the number of reflections it will take for a ray’s x and y values to equal the (x, y) values of the receiver , if aimed at the reflection point inside , starting from any position within the borders of (0, 0), (xp, 0), (xp, yp), and (0, yp). 4 3 2 3 3 2 1 2 3 yp 2 1 1 2 3 4 5 (0,0) x-axis xp 3 2 1 2 3 4 5 6 y-axis 4 3 2 3 4 5 6 7 5 4 3 4 5 6 7 8
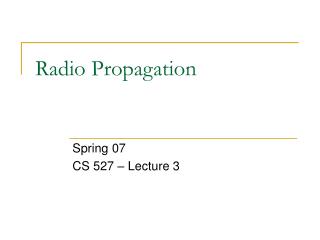
Template Ordered-pairs How do you find the exact coordinates to aim a ray at in order for it to reflect a specific number of times before it hits the receiver from the transmitter? Q: A: Table 1 shows the devised template design used to answer this question. By using the perimeters of the room and the coordinates of the receiver, one is able to determine these coordinates, and therefore the direction, to aim a ray at for any number of reflections desired. This principle works in both 2D and 3D however, in 3D the setup of correct ordered pairings is complicated. The variables used are: t - template number, R - number of reflections desired, and x, y, or z can be substituted for w. The t values are used to show the relation between the ordered-pairs of Reflection Points (bottom right)and the Template Ordered-pairs (top right) in this 2D setup. Reflection Points
(-2,3) (-1,3) (0,3) (1,3) The Template Ordered-pairs are shown in the bottom right of each square, and again in the center, the number of reflections the ray must undergo in order to get from transmitter to receiver. 4 3 2 3 4 5 6 (-2,2) (-1,2) (0,2) (1,2) (2,2) 3 2 1 2 3 4 5 6 (-2,1) (-1,1) (0,1) (1,1) (2,1) (3,1) (4,1) (5,1) yp 2 1 0 1 2 3 4 5 5 (-2,0) (-1,0) (0,0) (1,0) (2,0) (3,0) (4,0) (5,0) xp x-axis 3 2 1 2 3 4 5 5 6 (-2,-1) (0,0) (0,-1) (1,-1) (2,-1) (3,-1) (4,-1) (5,-1) y-axis 4 3 2 3 4 5 5 6 7 (-2,-2) (-1,-2) (0,-2) (1,-2) (2,-2) (3,0) (4,-2) (5,-2) 5 5 4 3 4 5 5 6 7 8
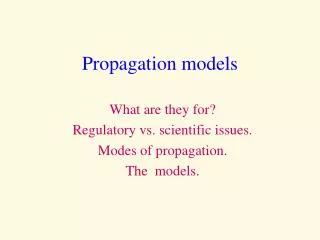
Plotting from Algorithms This is a plot of all points for R=1, 2, 3 ,4 and 5 produced by an algorithm developed using MATLAB software. The parallelogram in the center of the plot with the black perimeter represents a two dimensional room. The bottom left corner of which is located at the origin of the coordinate system (0,0). The algorithm, named “plot2D”, uses seven parameters in this order: R, xi, yi, xp ,yp, x, and y. Therefore the function for this plot is; plot2D(1:5, 1, 1, 10, 6, 7, 3). X – (x, y) → (7, 3) O – (xi, yi) → (1,1) (xp, yp) → (10,6)
3-D Problems The graph below shows the relationship between the number of paths (P) a ray can take in 2D and in 3D. As the number of reflections (R) increases their trend lines diverge. R vs. P for 2D and 3D x - 2D ○ - 3D The table above shows the ordered pairs of Reflection Points for 3D. As one can see the pattern is very different, although some similarities remain such as the first 4*R (x,y) coordinates are the same coordinates found in 2D, simply paired with the z variable for the receiver.
Reflection Structures in 3-D Each cube in the structures in Figure 2 is the reflection of the one located in the center of each, shown in Figure 1. The structures in Figure 2 from left to right represent reflections of this central cube for R = 1, 2, 3, 4, and 5, respectively. Each cube in each structure in Figure 2 would presumably have the reflection of the receiver from Figure 1 , imbedded within. Similar to the 2D model, a ray aimed at this point would reflect R number of times inside the central cube (Figure 1) before reaching the receiver from the transmitter. Figure 1 z y x Figure 2 z z z z z x y x x x x
Continuing Research… To apply this theoretical research, complete computer algorithms beyond the recently completed two dimensional one must be developed to map the three dimensional layout of radio signal propagation. Once accomplished, this program will be integrated with architectural drawings from any building, providing accurate predictions of radio signals throughout the structure. Currently, over three hundred signal strength measurements have been taken in the Science and Technology building and more measurements in multiple buildings are planned for the future. By measuring and studying signal propagation in different environments, we believe our research will establish a relation between radio transmission and various indoor environmental factors; consequently, we will be able to develop a practical radio propagation model that would give precise signal estimation for indoor wireless research.


![G3 - RADIO WAVE PROPAGATION [3 Exam Questions -- 3 Groups]](https://cdn3.slideserve.com/5901389/g3-radio-wave-propagation-3-exam-questions-3-groups-dt.jpg)