Download
1 / 4
40 likes | 117 Views
Supplemental data. NF concentration ( μ M ). 0. 0.25. 0.5. F4. F4. F4. WT. WT. WT. F7. F7. F7. F11. F11. F11. 0.75. 1. F4. F4. WT. WT. F7. F7. F11. F11. Shoot height ( mm ).

E N D
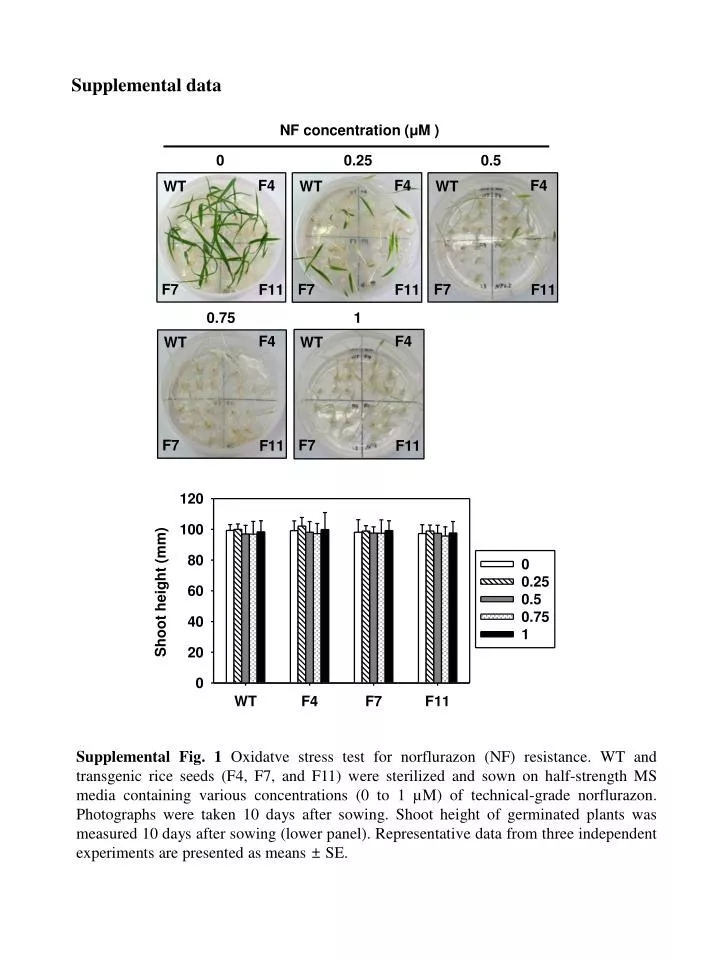
Supplemental data NF concentration (μM ) 0 0.25 0.5 F4 F4 F4 WT WT WT F7 F7 F7 F11 F11 F11 0.75 1 F4 F4 WT WT F7 F7 F11 F11 Shoot height(mm) Supplemental Fig. 1 Oxidatve stress test for norflurazon (NF) resistance. WT and transgenic rice seeds (F4, F7, and F11) were sterilized and sown on half-strength MS media containing various concentrations (0 to 1µM) of technical-grade norflurazon. Photographs were taken 10 days after sowing. Shoot height of germinated plants was measured 10 days after sowing (lower panel). Representative data from three independent experiments are presented as means ± SE.
PQ concentration (μM ) 0.01 0.05 0 F4 F4 F4 WT WT WT F11 F11 F7 F11 F7 F7 0.1 0.5 WT F4 WT F4 F7 F11 F11 F7 Shoot height(mm) Supplemental Fig. 2Oxidatve stress test for paraquat (PQ) resistance. WT and transgenic rice seeds (F4, F7, and F11) were sterilized and sown on half-strength MS media containing various concentrations (0 to 0.5 µM) of technical-grade paraquat. Photographs were taken 10 days after sowing. Shoot height of germinated plants was measured 10 days after sowing (lower panel). Representative data from three independent experiments are presented as means ± SE.
NaCl concentration (μM ) 50 250 0 150 WT WT WT WT F4 F4 F4 F4 F7 F11 F7 F11 F7 F11 F7 F11 Shoot height(mm) Supplemental Fig. 3Oxidatve stress test for salt resistance. WT and transgenic rice seeds (F4, F7, and F11) were sterilized and sown on half-strength MS media containing various concentrations (0 to 250 µM) of NaCl. Photographs were taken 10 days after sowing. Shoot height of germinated plants was measured 10 days after sowing (lower panel). Representative data from three independent experiments are presented as means ± SE.
PEG concentration (μM ) 15 5 10 0 WT WT F4 F4 WT WT F4 F4 F7 F7 F11 F11 F7 F7 F11 F11 Shoot height(mm) Supplemental Fig. 4 Oxidatve stress test for polyethylene glycol (PEG) resistance. WT and transgenic rice seeds (F4, F7, and F11) were sterilized and sown on half-strength MS media containing various concentrations (0 to 15 µM) of PEG. Photographs were taken 10 days after sowing. Shoot height of germinated plants was measured 10 days after sowing (lower panel). Representative data from three independent experiments are presented as means ± SE.