Download
1 / 12
140 likes | 439 Views
A Quick Introduction for Science Olympiad Students to. Interpreting Graphs. What are Graphs?. What is the purpose of a graph? How do we use graphs and why are they important? Where can we use graphs?. Title. Y Axis. X Axis. SOURCE DATA :.

E N D
A Quick Introduction for Science Olympiad Students to Interpreting Graphs
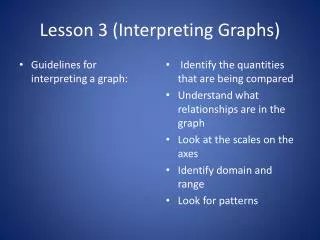
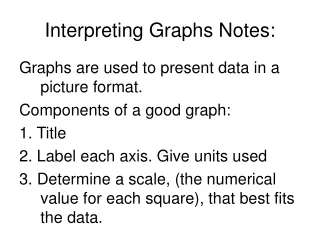
What are Graphs? • What is the purpose of a graph? • How do we use graphs and why are they important? • Where can we use graphs?
Title Y Axis X Axis
SOURCE DATA : USGS 03274000 http://waterdata.usgs.gov/usa/nwis/rt Great Miami River at Hamilton OH http://waterdata.usgs.gov/nwis/uv?cb_00060=on&cb_00045=on&format=gif_default&period=30&site_no=03274000
TM-P002. Persons per Square Mile: 2000Universe: Total populationData Set: Census 2000 Summary File 1 (SF 1) 100-Percent DataOhio by Census Tract
How to create a graph: http://www.jmu.edu/safetyplan/vehicle/generaldriver/stoppingdistance.shtml
Let’s do one more the period of a pendulum: http://www.ajdesigner.com/phppendulum/simple_pendulum_equation_period.php
Assignment • Create a graph using any type of data you would like. • Objectives • Show data table and include source of data (it must be real data) • Show at least one graph or chart of the data • Draw some conclusions from the data based upon the graph (relationships and trends) • Submit Electronically to lrso@promessage.com by 12/7/2008.