Download
1 / 48
500 likes | 635 Views
Six Sigma Project Title: Improvement of procurement process for the issuance of Printing Work Order Project No.: OAS-06-013 (1W ) (Revision 7, 23 October 2006).

E N D
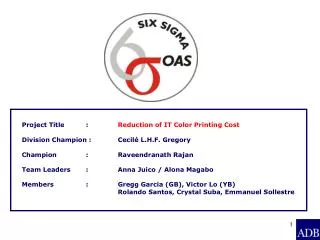
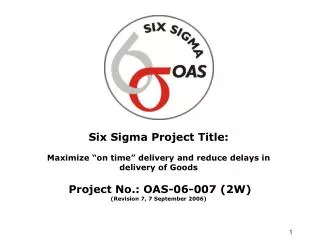
Six Sigma Project Title:Improvement of procurement process for the issuance of Printing Work Order Project No.: OAS-06-013 (1W)(Revision 7, 23 October 2006)
Champion: Cecile LHF GregoryLead Team Leader: Paulino P. Santiago Jr.Co-Team Leader: Bryan Cook Asst. Team Leaders: Ma. Corazon Panganiban and Manolo D. MacariolaMembers:Ces Tuason, Sarah Saranglao, Vic Lo, Vic Angeles and Anna Juico
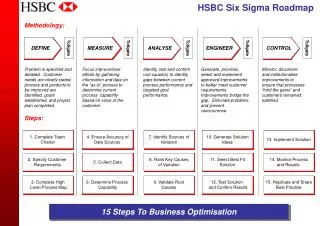
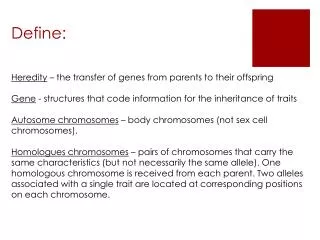
DEFINE Project Title:Improvement of procurement process for the issuance of Printing Work Order • PROJECT DESCRIPTION: • OAIS-PC receives a significant volume of work orders request for external printing requirements of OAIS-LM which requires fast processing. Delay in the issuance of work orders results to late delivery, delayed payment to supplier and has a negative impact on customer satisfaction. • PROBLEM STATEMENT: • Procurement process of external printing services needs to be improved in order to minimize delay in the issuance of work orders.
DEFINE Project Title: Improvement of procurement process for the issuance of Printing Work Order • GOAL STATEMENT: • To reduce by 20% the processing time for the issuance of work orders.
DEFINE Critical to Quality
Output characteristics/ Project Y Relationship Matrix DEFINE
High Level Process Map DEFINE
Detailed Process Map for WO “As Is” DEFINE
S P O C I Customer Output Supplier Process Input CTQs DEFINE S I P O C CTQs Requestor Request for Printing Services 1. Receives External Printing Request 2. Issues RFQs to Suppliers 3. Evaluates Bids/ Quotations 4. Submit request for Issuance of WO 5. Process WO 6. Issue WO to Supplier 7. Prepare PO for Payment purposes OAIS-LM • Timely • Issuance of WO • 2. Correct Specs. • and quantity • 3. Complete • Documentation Issuance of WO OAIS-LM RP and Request for WO Supplier
Time Line DEFINE Time Line Define Measure Analyze Improve Control 52 days 08 Feb.06 to 31 Mar.06 38 days 01 Apr.06 to 07 May 06 37 days 16 Aug.06 to 21Sep.06 27 days 12 Jan.06 to 07 Feb.06 100 days 08 May06 to 15 Aug.06
MEASURE Pareto Chart for RETA/TA Budget Printing WO N=26
MEASURE SAMPLE Data Collection Data collection sheets are in separate worksheets.
MEASURE Pareto Chart for Admin. Budget Printing WO N=37
MEASURE Process Capability for Project Y Admin. Budget Printing WO Distributioncurve
MEASURE Process Capability for Project Y Admin. Budget Printing WO
MEASURE Process Capability for Project Y Admin. Budget Printing WO Distributioncurve
MEASURE Process Capability for Project Y Admin. Budget Printing WO
MEASURE Process Capability for Project Y Admin. Budget Printing WO Distributioncurve
MEASURE Process Capability for Project Y Admin. Budget Printing WO
MEASURE Process Capability for Project Y RETA/TA Budget Printing WO Distributioncurve
MEASURE Process Capability for Project Y RETA/TA Budget Printing WO
MEASURE Process Capability for Project Y RETA/TA Budget Printing WO Distributioncurve
MEASURE Process Capability for Project Y RETA/TA Budget Printing WO
MEASURE Process Capability for Project Y RETA/TA Budget Printing WO Distributioncurve
MEASURE Process Capability for Project Y RETA/TA Budget Printing WO
Cause-and-Effect Diagram ANALYZE People/Dept. Supplier Process / Procedure / Policy OAIS-LM Lack of manpower AO & AC Capacity Delayed initiation of RP OAIS-PC Volume of Work Signing of WO Batching of request Late submission of bids/quotes Volume of request Seasonal Jobs Timely delivery of goods Process work flow Type File Need-date Type of Publication Type of publications Softwarei.e. Oracle System Revision of specs. Accuracy/complexity of specs. Lack or not clear specs. Specs. & Type of materials Technology & Communication
Cause-and-Effect Diagram N N N N N N N N C C C C C C C C C C ANALYZE People/Dept. Supplier Process / Procedure / Policy OAIS-LM Lack of manpower AO & AC Capacity Delayed initiation of RP OAIS-PC Volume of Work Signing of WO Batching of request Late submission of bids/quotes Volume of request Seasonal Jobs Timely issuance of WO Process work flow File Type Need-date Type of Publication Type of publications Softwarei.e. Oracle System Revision of specs. Accuracy/complexity of specs. Lack or not clear specs. Specs. & Type of materials Technology & Communication
Cause-and-Effect Diagram Prioritize list of Cs ANALYZE People/Dept. Supplier Process / Procedure / Policy OAIS-LM Lack of manpower Delayed initiation of RP OAIS-PC Volume of Work Batching of request Late submission of bids/quotes Volume of request Timely issuance of WO Process work flow Revision of specs. Type of Publication Accuracy/complexity of specs. Lack or not clear specs. Specs. & Type of materials
IMPROVE PARETO for the Control Factors
IMPROVE Proposed Solution Proposed Solutions 1. OAIS-LM to initiate RP simultaneous with submission of request for Work Order. 2. OAIS-LM to remind suppliers to submit quote a day before the deadline for submission of quotes. 3. OAIS-PC to prioritize processing of WO based on urgency and importance. 4. OAIS-LM and printing requestor to finalize specifications before RFQs are sent to prospective suppliers. 5. Medium Term Solution – To develop annual supply agreement. 6. Long Term Solution – To develop supplier management system for printing work order.
IMPROVE Proposed Solution
Detailed Process Map for WO “To be Process Map” IMPROVE
IMPROVE FAILURE MODE and EFFECT ANALYSIS (FMEA) SEV – Severity PROB/OCC – probability of occurrence DET – Detection RPN – Review Risk Priority Numbers: prioritize item that requires additional quality planning or actions
DATA Gathered IMPROVE • Data gathered for improvement phase • Admin. Work Orders • Number of Data points: 38 • Period: 1 June to 21 September 2006
IMPROVE Hypothesis Test Ho: mu1 = mu2 Null Hypothesis: There is no difference between the “as is” process and the “improved” process. Ha: mu1 is not = mu2 Alternative Hypothesis: There is a difference. Since P < 0.05 (0.000), we will reject Ho and accept Ha. Therefore, there is a difference between the “as is” and the “improved” sample data. Since the data is non-normal, we used the non-parametric tools by Mann Whitney. Mann-Whitney Test and CI: Total Orig., Total N Median Total Orig 37 85.00 Total 38 28.50 Point estimate for ETA1-ETA2 is 53.00 95.1 Percent CI for ETA1-ETA2 is (37.99,69.99) W = 2014.0 Test of ETA1 = ETA2 vs ETA1 not = ETA2 is significant at 0.0000 The test is significant at P =0.0000 (adjusted for ties)
Report for improved process (Total Admin. Process) IMPROVE Report for improved process
Report for improved process (Total Admin. Process) IMPROVE Previous process sigma is 1.50. Therefore an improvement of 4.26 was realized.
Report for improved process (Total LM Process) IMPROVE
Report for improved process (Total LM Process) IMPROVE Previous process sigma is 1.49. Therefore an improvement of 3.16 was realized.
Report for improved process (Total PC Process) IMPROVE
Report for improved process (Total PC Process) IMPROVE Previous process sigma is 1.48. Therefore an improvement of 3.07 was realized.
Table of Summary IMPROVE
= current X = desired = direct influence = indirect influence Control Stakeholder Analysis X
Control Risk Assessment Matrix
Control Mistake Proofing & Control Sheet
Control Sheet • Control Sheets • Best Practices / Operational Manual • Internal Audit Checklist • Control Plan for Key Performance Measure
Financial Benefits • SOFT SAVINGS • Avoidance of Capacity Enhancement • Increase Customer Satisfaction • Increase Employee Satisfaction • Compliance with Procurement Procedure