Download
1 / 11
110 likes | 249 Views
Project MYANMAR. Soe Thet Aung | Min Thu Han | Aung Myint Thein | Htin Kyaw. Idea Origin and Motivations. Agriculture country Surrounded by dominant economies such as China, Thailand and India No systematic and organized presentation of the data

E N D
Project MYANMAR SoeThetAung | Min Thu Han | AungMyintThein| HtinKyaw
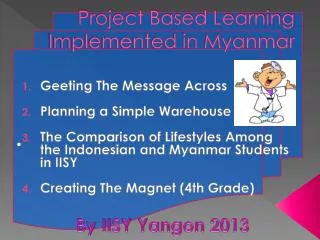
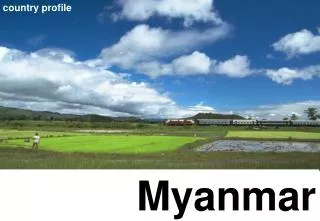
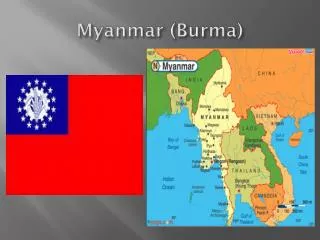
Idea Origin and Motivations • Agriculture country • Surrounded by dominant economies such as China, Thailand and India • No systematic and organized presentation of the data • Our goal – Interactive and comprehensive web content of Myanmar’s agriculture data
Application Features • Visualization of Industrial Statistics • Crop distribution • Mechanization • Population Distribution and Density
Related Works • Myanmar Agriculture Digital Atlas • Odisha Sampad Atlas
Resources • Data sources • Digital Agriculture Atlas Database – agriculture information • Myanmar Information Management Unit – Population information • Software • JavaScript • JSON, GeoJSON • PolyMap, Protovis • PostgreSQLwith PostGIS extension • PHP
Architecture GeoJSON Javascript php PostGIS polymaps protovis
Key Technical Challenges • Data Storage and Conversion on the go • Analytical Spatial SQL Query and PostGIS • GeoJSONConversion • Mastering Multiple Languages • Polymaps and Protovis • JavascriptFor Interactive Interface and Page Design • PHP and PostGIS
Project Milestones • Week 9 – Connecting Javascript with Polymap, Protovis extensions and PostGIS database, familiarizing with Javascript • Week 10 – Application layout and usability • Week 11 – Application layout and integration • Week 12 – Usability testing and feedback • Week 13 – polishing and adjustments. Poster presentation
Task allocation and focus area • AungMyintThein • PostGIS , PHP and Javascript • SoeThetAung , Min Thu Han • Polymap, Protovis and Javascript • HtinKyaw • Protovis , Interface and Visualization Designs