Download
1 / 32
330 likes | 517 Views
S-DWH Business Architecture: Generic Process Models Summary : The Data Warehouse approach as a Single Coherent Production System. Business process analysis of a SDWH: Generic Statistical Business Process Model (GSBPM ). ----end first part Business Process Model Notation (BPMN )

E N D
S-DWH Business Architecture: • Generic Process Models • Summary: • The Data Warehouse approach as a Single Coherent Production System. • Business process analysis of a SDWH: • Generic Statistical Business Process Model (GSBPM). • ----end first part • Business Process Model Notation (BPMN) • Mapping the BPM-Notation on a SDWH layerd architecture: • interactive session National Institute of Statistics – Italy Antonio Laureti Palma - IT - Structural Business Statistics Unit Mauro Masselli - Head of Structural Business Statistics Unit Workshop “ESS NET on “Micro data linking and warehousing in statistical production “ Cardiff 23-24 May 2012
Statistical stove-pipe-like production system • In a stove-pipe production system every single production line corresponds to a specific topic of statistics, with its own production system. So, from survey design to dissemination, the whole production process, for each topic of statistics, takes place independently and with its own data suppliers and user groups: Structural Business Statistics Short Term business Statistics Information Society elaboration output Science Technology Innovation SBS SBS Business Register STS STS Administrative survey data IS IS STI STI BR
The Data Warehouse approach as a Single Coherent System • The Statistical Data Warehouse (SDWH) for business statistics, in our vision, is a central statistical data store regardless of the data’s source, for managing all available data of interest, improving the NSI’s ability to: • (re)use data to create new data/new outputs; • perform reporting; • execute analysis; • produce the necessary information. Structural Business Statistics Short Term business Statistics Information Society elaboration output Science Technology Innovation SBS Business Register STS ….administrative data Data Warehouse survey data IS STI SBR
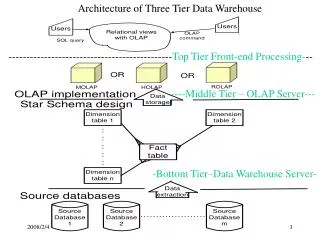
The Data Warehouse approach as a Single Coherent System • To provide such a DWH architectural vision in the context of statistics production, we could use a DWH architecture model of four functional layers: • source layer, is the level in which we locate all the activities related to storing and managing internal (surveys) or external (archives) raw data sources. • integration layer, on this layer performs the typical Extraction Transformation and Loading functions; which must be realized in automatic or semi-automatic ways • interpretation and data analysis layer is specialized to interactive and not structural activities. • access layer is addressed to a wide typology of users or informatics instruments for the final presentation of the information sought
The Data Warehouse approach as a Single Coherent System • The SDWH is then at the center of a corporate information statistical domain (group of topics), in which all production processes follow a coherent design. • To define and enable its evolution requires creating, communicating and improving the key requirements, principles and models. • A high level of coordination is necessary both within different topics and within different operational phase activities, and between the topics and activities.
The Data Warehouse approach as a Single Coherent System • Consequently, any NSI adopting a SDWH approach as single coherent system, or part of it, should adapt business production architecture, information system architecture and technology architecture: • The Business Architecture aligns strategic objectives and tactical demands. This provides a common understanding of the organization described by the management processes and business operational processes. • The Information Systems Architecture, in our context, is the design of an effective SDWH, in terms of data and metadata, which can support tactical demands. • The Technology Architecture, is the combined set of software, hardware and networks to develop and support IT services.
The Data Warehouse approach as a Single Coherent System • The key business processes within the business architecture for statistics that should generally be considered are: • Statistical program management (new or redesign of processes); • Project management; • Resource management; • Operational management (data and metadata generated); • Metadata management (generated and processed within each phase); • Data management (security, custodianship and ownership); • Customer management (promoting statistical product); • Statistical framework (standards, methodologies and concepts); • Quality management (assessment and control); • Burden management; • Knowledge management; • Software and IT infrastructure management.
Modeling the Business Architecture • In statistics, a possible standard representation to describe a Business Architecture is the Generic Statistical Business Process Model (GSBPM). Here are 9 phases to describe and define the set of statistical business processes required to produce official statistics: • 1 Specify Needs, • 2 Design, • 3 Build, • 4 Collect, • 5 Process, • 6 Analyze, • 7 Disseminate, • 8 Archive, • 9 Evaluate. • Each phase is articulated by several sub statistical processes; which, according to process modelling theory, each sub-process should have a number of clearly identified attributes (input, output, owner, purpose, guide, enablers, feedback,..)
business architecture- business operational processes • Up to now, in WP3 activity, we have restricted this analysis to business operational processes which include phases 4 to 7 of the GSBPM : • 4 Collect - This phase collects all necessary data, using different collection modes, and loads them into the appropriate data environment. • 5 Process - This phase describes the cleaning of data records and their preparation for analysis. For statistical outputs produced regularly, this phase occurs in each iteration. • 6 Analyze -In this phase, statistics are produced and examined in detail. The “Analyze” and “Process” phases can be iterative and parallel; analysis can reveal a broader understanding of the data, which might make it apparent that additional processing is needed. • 7 Disseminate- This phase manages the release of the statistical products to customers. For statistical outputs produced regularly, this phase occurs in each iteration.
Business process in the SDWH Layered Architecture • Source Layeris the level in which we locate all the activities related to storing and managing internal (surveys) or external (archives) raw data sources. • Typically, this phase does not include any transformation of collected data but it should include information on how, when and from who the collection has been finalized. • Analyzing the GSBPM, sub-processes activity that could be included in this layer are: • 4- Collect: • 4.2-set up collection, • 4.3-run collection, • 4.4-finalize collection.
Business process in the SDWH Layered Architecture • Integration layer activities on this layer performs the typical Extraction Transformation and Loading functions; which must be realized in automatic or semi-automatic ways. • All the activities of this layer are related to regular iterations processes and structured activities. Which clean, link and harmonize data-information in a common operational persistent area. • Analyzing the GSBPM, we include on this layer:
Business process in the SDWH Layered Architecture • Interpretation and data analysis layeris specialized to interactive and not structured activities. • On it are grouped all functionalities able to support expert users for producing strategic value information or design new statistical strategies.On this layer experts can design the complete process of information delivery. • Sub-processes in this layer must be suitable to support experts for free data analysis also in order to test any possible statistical methodology, or strategy, able to satisfy regular production process of any future iterations in the integration layer. • Analyzing the GSBPM, we include on this layer:
Business process in the SDWH Layered Architecture • Access Layeris addressed to a wide typology of users or informatic instruments for the final presentation of the information sought. • In order to support different typology of users sub-process in this layer must be able to transform, or efficiently manipulate, data-information already estimated and validated in the previews layers and able to apply disclosure controls. • Specialized Business Intelligence tools, on it we should consider also graphics and publishing tools are able to generate graphs and tables for users. • Software interface towards others external integrated output system, typical example is the interchange of macro data information via SDMX. • Analyzing the GSBPM, we include on this layer:
business architecture – BPM Notation data A: sub-process which must be done Actor • To describe processes, during analytical activities, we have used the Business Process Model Notation (BPMN), in a simplified version, in which only four descriptor objects are used, they are: • activity object describes the actor and the sub –process which must be realized. • sequence flow object shows in which order the activities are performed; • association object is used to associate objects, and can indicate some directionality using an open arrowhead, toward the object to represent a result, from the object to represent an input, and both to indicate it is read and updated; • data objects (representedwith a rhombus) show the readerwhich data isrequired or produced in anactivity.
business architecture – BPM Notation • Example of work flow using the BPM Notation: B, C: 4.2 set up collection B, C: 4.1 select sample C: 4.3 run collection Satistical Business Register surveys data A: 5.2 classify & code (priorities) administrative data A: 5.3 review, validate & edit A: 5.1 integrate data Legend: A: Register unit B: Statistical Methods unit C: Information Collection department
business architecture – BPM Notation Analysis • To begin a design of a business architecture for a generic SDWH for business statistics we focus our analysis on operational processes of specific output variables. • Business operational view, defines the set of strategic, core and support operational structures that transcend functional and organizational boundaries. • It also sets the boundary of the enterprise by identifying and describing external entities such as customers, suppliers, and external systems that interact with the business. • The operational structures describe which resources and controls are involved. The lowest operational level describes the manual and automated tasks that make up workflow.
Business Architecture – BPM Analysis • In order to gain insight into how to design a business architecture we have asked each ess-net participant to make an analysis on operational production lines of specific output variables related to Structural Business Statistics (SBS), Short Term Statistics (STS) and the Statistical Business Register using the BPMN. • This choice was motivated by the intent of emphasize statistical-domain and production-timing dependences: • for SBS we have considered: • System of company accounts, • PRODuctionCOMmunautaire; • for STS we have considered: • Monthly industrial production • Monthly retail sales • Quarterly turnover in the services • Quarterly services producer prices • External Trade statistics. • Detailed synthetic results will be shown later, as example, to prepare the interactive session.
BPM Analysis: Structural Business Statistics SBS • The Structural Business Statistics SBS cover industry, construction, trade and services. Presented according to the Statistical Classification of Economy Activity in the European Union (NACE 2) activity classification, they describe the structure, conduct and performance of businesses. • Generally SBS does not collect information on products. The external trade and the production of specific products are covered by Prodcom and external trade statistics.
BPM Analysis: External Trade statisticsET • The External Trade statistics track the value and quantity of goods traded between EU Member States (intra-EU trade) and between Member States and non-EU countries (extra-EU trade). • They are the official source of information on imports, exports and trade balance of the EU, its Member States and the euro area. • We will make a top-down analysis of the two ET measures, independently from the products. These measures are related to other statistical production lines considered:
BPM Analysis: Short-term statistics (STS) • Short-term statistics (STS) describe the most recent developments of country economies. STS cover four major economic domains: industry, construction, retail trade and other services. • In the field of STS, the development in the different economic domains is described with a series of indicators (STS indicators) such as production, turnover, new orders received, prices, number of persons employed, gross wages and several more. STS indicators are published as indices which show the changes of the indicator in comparison with a fixed reference year. • STS indicators are generally published with a monthly frequency. These measures are related to other statistical production lines considered:
BPM Analysis: Statistical Business Register(SBR) • The Statistical Business Registeris a registerofallenterprisesaswellastheirworkplaces. The availability of Statistical BRs is the key to the compilation of consistent and comparable short-term and structural business statistics. • SBRs are crucial for establishing efficient statistical survey frames which aim to reduce the reporting burden on enterprises. • We will make a top-down analysis from two significant BR values, which even if they are not objects of direct statistical output at Estat level, have an important impact on economic-stratification characteristics for STS and SBS:
BPM Analysis: Statistical Business Register (PT-Case) B, C: 4.2 set up collection C: 4.3 runcollection Surveys data B 4.1 select sample A: 5.2 classify & code (priorities) Complete SBR (T-1) Administrative data A: 5.3 review, validate & edit SBR A: 5.1 integrate data SBR changes (T-1) A: 6.2 validate outputs F, G: 6.2 validate outputs A: Register unit B: Statistical Methods unit C: Information Collection department D: Dissemination unit E: Statistical Producers units F: Economical Statistics department G: National Accounts department A: 7.1 update output systems • D, E: 7.2 produce dissemination products
Mapping the BPM-Notation on a SDWH layerd architecture • Preparation of the interactive session: • Process goal information from SBS, STS, ET and SBR strategies will then be used to derive the most realistic step towards a SDWH-Business Architecture. • In the following we will analyse each GSBPM phase trying to allocate the relative sub processes on a SDWH layered architecture. • Mapping the GSBPM operational process on a SDWH architecture means a process flow through functional layers.
Mapping the BPM-Notation on a SDWH layered architecture • To this aim, it will be used a graphical mapping of GSBPM on a SDWH layered architecture, where: • GSBPM phases are on horizontal axis on different columns • SDWH layers are on vertical axis on different rows • they cross produce a cell-matrix representation of possible sub-processes. • gray diagonal represents, in a generic statistical process, the most likely association area between SDWH-layers and GSBPM phases. 5 Process 6 Analyze 7 Disseminate 4Collect 4.2 4.3 4.4 5.1 5.2 5.3 5.4 5.5 5.6 5.7 5.8 6.1 6.2 6.3 6.4 6.5 7.1 7.2 7.3 7.4 7.5 4.1 access Layer interpretation and analysis layer integration layer source Layer
Mapping the BPM-Notation on a SDWH layered architecture • To include a sub-process in a process flow we fill a matrix cell with a circle and connect subsequent sub-processes. • As on BPMN, rhombus are representing data objects and must be positioned at layer level. • In order to identify actor of each sub-process we fill each circle with several color. The different actors will be referenced on a separated legend with the associated color. CAWI 5 Process 6 Analyze 7 Disseminate 4Collect 4.2 4.3 4.4 5.1 5.2 5.3 5.4 5.5 5.6 5.7 5.8 6.1 6.2 6.3 6.4 6.5 7.1 7.2 7.3 7.4 7.5 4.1 access Layer interpretation and analysis layer integration layer admin balance-fiscal-tax source Layer CAWI Legend: A - Data collection department B- Enterprise statistical department
Mapping the BPM-Notation on a SDWH layerd architecture • The picture shows an example of GSBPM on SDWH mapping of the Statistical Business Register operational process made by PT:
Mapping the BPM-Notation on a SDWH layered architecture • The picture shows a merge of all BPM analyzed from all statistical processes of different ess-net members on the SDWH, it is evident the articulated allocation of the overlap of several production.