Download
1 / 30
310 likes | 578 Views
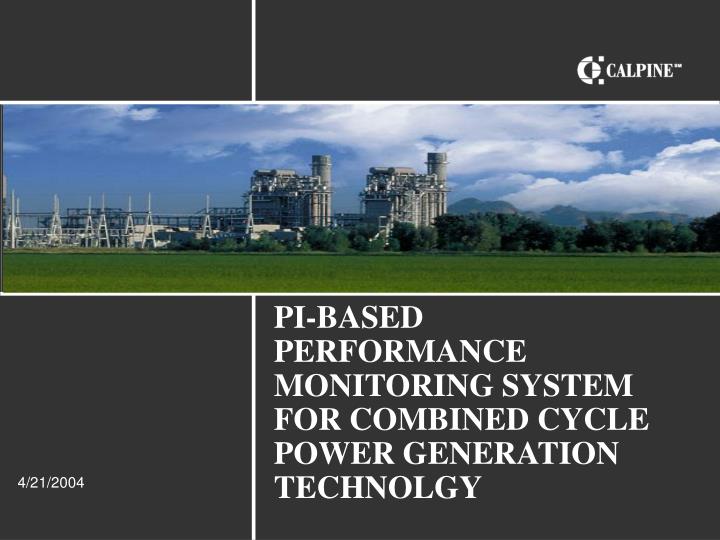
PI-BASED PERFORMANCE MONITORING SYSTEM FOR COMBINED CYCLE POWER GENERATION TECHNOLGY. 4/21/2004. About Calpine. Founded in 1984 Headquartered in San Jose, Calif.

E N D
PI-BASED PERFORMANCE MONITORING SYSTEM FOR COMBINED CYCLE POWER GENERATION TECHNOLGY 4/21/2004
About Calpine • Founded in 1984 • Headquartered in San Jose, Calif. • Calpine has 87 energy centers in 21 states in the U.S., as well as in Canada and the United Kingdom with a total capacity of about 22,000 megawatts • Uses clean, proven technologies: natural gas combined-cycle and geothermal energy
A Large Portfolio Calpine offices • Boston, MA • Calgary, Canada • Dublin, CA • Ft. Collins, CO • Houston, TX • Jupiter, FL • Northbrook, IL • Portland, OR • Tampa, FL • Folsom, CA Corporate headquarters • San Jose, CA As of 4/21/2003
Large, regionally diverse fleet requires central performance monitoring to provide the following; • Standard fleet reporting/comparison • Operational benchmarking • Asset improvement and degradation quantification Performance Monitoring Necessity Value • Economic decisions based on operating performance data • Internal knowledge and understanding of equipment • Efficient and reliable operation
Calpine chose to use OSI-PI as the foundation for our Performance Monitoring System • Existing PI infrastructure eliminated additional capital expense • Internal reliance and control • PI provides all the required functional components of 3rd party systems • Development team and end-users already familiar with PI tools/systems Why Use PI? Value • Zero additional capital cost associated with PI • Zero new training • Zero external reliance • Zero risk
PERFORMANCE MONITORING SYSTEM ARCHITECTURE Consumable Products • Wholesale Energy Products • Retail Power • Renewable Energy • Overview of Calpine PI network • PI Performance Equations • PI Process Book as GUI • PI Datalink and Excel employed as on-line QC
PI at Calpine • Calpine standardized on PI as their operations historian in early 2001 • PI is installed at 86 of Calpine’s 89 generating facilities • The fleet PI infrastructure consists of 62 production PI servers and 24 PI API nodes • Calpine PI data for every site is available remotely to every Calpine employee, from plant personnel to executive management, because all Calpine PI systems are connected to the Calpine WAN Calpine PI Infrastructure
PI Performance Equations • PI Performance Equation Subsystem used as backbone to calculate performance data • Average of 350 Performance Equations per site constructed by Calpine Performance Engineers • Calculations based on standard calculations as well as plant specific calculations • Daily averaging functions used to easier identify performance trends and create summary reporting
PI Process Book as GUI • PI Process Book used to view raw and calculated performance data • 13 Monitoring Displays and 14 Trend Displays • Multiple individual PDI files used as opposed to a single PIW file • Navigation created using VB Code
C O M P OU N D A N N U A L G R O W T H R A T E 1 9 9 7 T O 2 0 0 2
PI Datalink as On-Line Quality Control Data Quality Critical • PI Datalink used to ensure data integrity • Standard statistical evaluation of data used to evaluate data integrity • PI Datalink used to summarize data and draw conclusions
TECHNICAL CHALLENGES • Text Based Filtering in Performance Equations • Getting the Most out of the Performance Equation Subsystem • Correction Calculation Challenges
Text Based Filtering • Identified a need to display why corrections were not being applied • Solution must not affect summary data • Early solution was to display “-1” when corrections not applied
Text Based Filtering Solution • Final solution was to display text when corrections not applied • Text to be used in the tags must be present in the “System” Digital Set within the PI System • Text is not taken into account when summary equations are applied
Maintaining the PI-PE Subsystem • Found that 200 calculations is the approximate limit for a Performance Equation Scheduler • Set up multiple schedulers to spread the load • With the number of equations, and the complexity of the equations, Performance Equation Schedulers would fail from time to time • Set up Performance Equation Schedulers to be restarted regularly to minimize impact. • Used 3rd Party Software to notify when calculations are experiencing issues
Technical Challenges The Challenges Site instrumentation errors / lack of site instrumentation Each plant uses different tag naming conventions PI was originally configured primarily as a Data Historian – PI tags typically have various levels of compression and exception enabled Gas Turbine based performance indicators vary drastically with load and ambient conditions The Solutions Correction, re-calibration, procurement of critical site instrumentation Standard PI tag naming convention applied to primary site tags (fuel, power, ambient conditions) PI compression and exception removed on critical performance tags – filtering applied where required Load Normalization Apply OEM ambient corrections at normalized (base) load Use PI-based text substitution to allow functional averaging and Process Book trending
Performance Trend of CTG Corrected MW
Value Realization Examples • Use PI based Performance Monitoring to conduct DWR contractual annual capacity tests on (15) simple cycle peakers in CA • Quantify recoverable CTG degradation by analyzing pre and post offline water wash performance • Remote monitoring identifies operational procedure mispractice and optimizes plant performance Value • Eliminate dedicated on-site test personnel and temporary test instrumentation – Estimated savings of $200K annually • Accurate recoverable degradation data allows the sites to optimize CTG water washing based on market conditions • In a low spark spread market, every optimization opportunity can significantly contribute to Calpine’s profitability
Performance Monitoring System vs. Performance Test Calpine Simple Cycle Peaker Plant Performance Test Results Comparison Calpine 3 x 1 Combined Cycle Plant Performance Test Results Comparison The Performance Monitor calculations fall within the 1% uncertainty band for power and slightly outside the 1.5% uncertainty band for heat rate. This is very good considering that the tests use different instrumentation and the acceptance test uses more measurements and more corrections in their calculations.
Performance Quantification CTG 2 Water Wash CTG 1 Water Wash CTG 2 Water Wash CTG 1 Water Wash
Summary Calpine is successfully leveraging OSI-PI technology in a Performance Monitoring environment directly resulting in; • Increased plant availability and reliability • Predictive maintenance scheduling • A historical plant performance database that can be used to effectively optimize plant and fleet performance • Better decision support data available to dispatch and trading • INCREASED CALPINE PROFITABILITY !