Download
1 / 16
160 likes | 313 Views
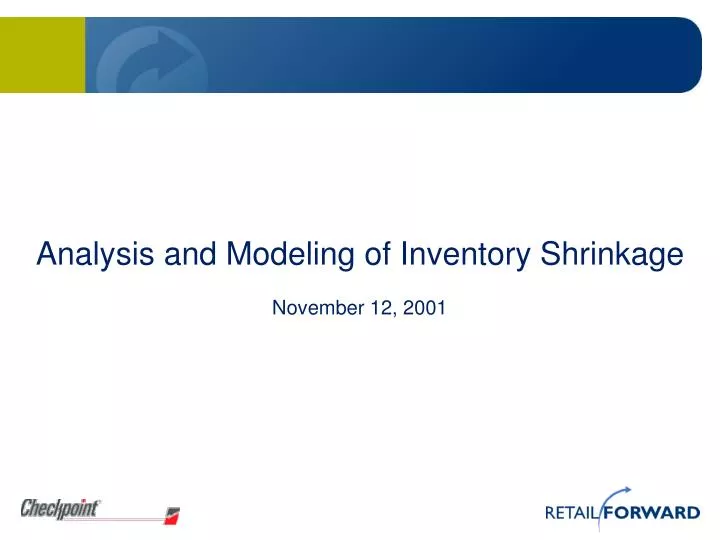
Analysis and Modeling of Inventory Shrinkage November 12, 2001 . Inventory Shrinkage from Shoplifting. (Billions of Dollars, Actual vs. Predicted). $16. $15. $14. $13. $12. $11. $10. $9. $8. $7. 1993. 1994. 1995. 1996. 1997. 1998. 1999. 2000. 2001. 2002. Summary.

E N D
Analysis and Modeling of Inventory Shrinkage November 12, 2001
Inventory Shrinkage from Shoplifting (Billions of Dollars, Actual vs. Predicted) $16 $15 $14 $13 $12 $11 $10 $9 $8 $7 1993 1994 1995 1996 1997 1998 1999 2000 2001 2002 Summary The current economic downturn will increase inventory shrinkage from shoplifting by $1 billion in 2002, based on the economic model developed in this report. The graphic shows the incremental cost triggered by rising unemployment and growing strain on household spending, compared with what might have been expected if the economy had continued to grow at its 2000 pace. $1 billion increase in shrinkage from shoplifting because of economic downturn. Source: Retail Forward Inc., U.S. Department of Commerce, University of Florida Retail Security Survey, and FBI Uniform Crime Reports
Summary The estimated cost is based on an economic model that found that shoplifting trends can be explained by changes in unemployment claims, the savings rate and retail prices. The growing population of youth age 15 to 24 represents another factor that will tend to increase inventory shrinkage from shoplifting. These economic factors should reverse the trend of recent years during which shoplifting eased as a source of inventory shrinkage. In total, shrinkage from all sources shoplifting, employee theft, vendor fraud and paperwork error reached an estimated $39 billion in 2000. Shoplifting accounted for one-third of the total. Table of Contents: Page Summary 2 Background on Total Shrinkage 4 Focus on Shoplifting Shrinkage 8 An Economic Model of Shoplifting 10 The Modeling Approach 12 Population as Another Key Driver 15
2.0% 1.9% 1.8% 1.7% 1.6% 1.5% 1.4% 1.3% 1.2% 1.1% 1.0% 1993 1994 1995 1996 1997 1998 1999 2000 A Positive Recent Trend During the booming economy of recent years, inventory shrinkage – from all sources – has seemingly remained under control. In 2000, total shrinkage slipped to 1.7% of retail sales, according to a survey by the University of Florida. Over the last eight years, shrinkage has trended slightly downward from nearly 2.0% of retail sales in 1994. Total Shrinkage as a Percentage of Retail Sales Source: University of Florida National Retail Security Survey
Consumer electronics & appliances 0.9% Furniture & household furnishings stores 1.0% 1.3% Shoe stores Supermarkets & grocery stores 1.6% Sporting goods stores 1.6% Total Retail 1.8% Home centers, lumber & garden supply 1.8% 1.8% Jewelry & optical stores Department stores 1.8% 1.8% Apparel stores (men, women & children) Discount stores 2.0% Drug stores & pharmacies 2.1% Convenience, liquor wine & beer stores 2.1% Toy & hobby stores 2.1% Recorded music & video stores 2.3% Book stores/ greeting card & novelty shops 2.3% 0.0% 0.5% 1.0% 1.5% 2.0% 2.5% Differences by Retail Segment Not surprisingly, segments such as book and music stores that sell smaller-sized products have higher inventory shrinkage rates compared with segments such as consumer electronics and furniture stores that sell larger products. Although these rates by segment are volatile year-to-year, they show that the economic slowdown in 1996 resulted in a noticeable increase in shrinkage rates for discount stores, department stores and furniture/home furnishings stores. Shrinkage as Share of Sales by Type of Retailer (Average Since 1993) Source: University of Florida National Retail Security Survey and Retail Forward Inc.
Total Inventory Shrinkage (billions of dollars) $45 $40 $35 $30 $25 $20 $15 $10 $5 $0 1993 1994 1995 1996 1997 1998 1999 2000 2001 Source: University of Florida Survey, U.S. Department of Commerce and Retail Forward Inc. Total Costs Still Rising Despite the slight decline in the overall shrink rate in recent years, inventory shrinkage measured in dollars rose to an estimated $39 billion in 2000 from $30 billion in 1993 as the total retail market grew briskly over that time span. The losses are estimated at retail value by applying the annual shrinkage rates to total retail sales. Total retail sales, excluding motor vehicle sales and food service, registered $2.3 trillion in 2000, according to the U.S. Department of Commerce.
Sources of Shrinkage in 1996 Sources of Shrinkage in 2000 Vendor Fraud 6% Vendor Fraud 5% Paperwork Error Paperwork Error 19% Shoplifting 18% Shoplifting 36% 33% Employee Theft 38% Employee Theft 44% A Shift in Sources of Shrink During the economic boom of recent years, slower growth in shoplifting contributed to a striking shift in the sources of shrinkage. As shoplifting became a significantly smaller share of shrinkage by 2000, employee theft grew to be a larger share of shrinkage compared with 1996. Source: University of Florida National Retail Security Survey
Inventory Shrinkage by Source (billions of dollars) $45 $40 Total Shrinkage $35 $30 $25 $20 $15 Shrinkage from Shoplifting $10 $5 $0 1993 1994 1995 1996 1997 1998 1999 2000 2001 Source: University of Florida Survey, U.S. Department of Commerce and Retail Forward Inc. Shoplifting Lagged in Good Times As shoplifting grew slowly during the boom times, it noticeably lagged the growth of total inventory shrinkage. Shrinkage from shoplifting is estimated at nearly $13 billion in 2000, which is only modestly higher than the $12.2 billion estimated for 1996.
1,600 1,400 1,200 1,000 800 600 400 200 * Cases prior to 1975 derived from crime reports data - 1968 1970 1972 1974 1976 1978 1980 1982 1984 1986 1988 1990 1992 1994 1996 1998 2000 Shoplifting Cases Declined The slow growth in shrinkage from shoplifting corresponds with a dramatic decline in the number of shoplifting cases reported by the FBI since 1996. This decline in shoplifting was likely the result of a booming economy. Plummeting unemployment rates and strong income growth dramatically reduced the factors that cause people to shoplift. Shoplifting Cases As a result, the number of shoplifting cases is likely to increase significantly in 2001 and 2002 as the U.S. economy deteriorates. (in thousands) Source: FBI Uniform Crime Reports and Retail Forward Inc.
Shoplifting Cases (Actual vs. Predicted) 1,600 1,400 Actual 1,200 1,000 Predicted 800 600 400 200 - 1968 1970 1972 1974 1976 1978 1980 1982 1984 1986 1988 1990 1992 1994 1996 1998 2000 2002 Shoplifting Will Rise Again The expectation that an economic downturn will increase retail inventory shrinkage is confirmed by an economic model of shoplifting. The model shows that most of the change in shoplifting over time can be explained by three variables: unemployment claims, the savings rate and retail prices. Shoplifting tends to increase with rising unemployment claims, a growing savings rate and higher retail prices. The model predicts a jump in shoplifting in 2001 and 2002, assuming the recent rise in jobless claims and saving persists into 2002. Source: FBI Uniform Crime Reports and Retail Forward Inc.
Inventory Shrinkage from Shoplifting (Billions of Dollars, Actual vs. Predicted) $16 $15 $14 $13 $12 $11 $10 $9 $8 $7 1993 1994 1995 1996 1997 1998 1999 2000 2001 2002 $1 Billion Cost The predicted increases in shoplifting cases translate into $1 billion of incremental shrinkage losses in 2002 for retailers from shoplifting alone. These losses are calculated by comparing shoplifting shrinkage given higher unemployment claims and savings to the shrinkage that would have been expected if unemployment claims and savings remained at their 2000 pace. $1 billion increase in shrinkage from shoplifting because of economic downturn. Source: Retail Forward Inc., U.S. Department of Commerce, University of Florida Retail Security Survey, and FBI Uniform Crime Reports
The Modeling Approach The economic model emerged from a statistical modeling process that considered a range of potential explanatory variables. Considered were 15 macroeconomic variables, plus another 14 population age brackets. A number of these variables, including certain population variables, showed a significant relationship to shoplifting. The three variables in the model were the combination that together best explained movements in shoplifting. These were the variables considered as potential explanatory variables in the modeling: Retail Sales Less Autos & Gasoline Income Consumer Credit Saving Rate Housing Starts Employment Manufacturing Employment Unemployment Rate Unemployment Claims Unemployed Persons Price Index for Retail Sales Less Autos & Gasoline Core Consumer Price Index (excluding food & energy) Gasoline Prices 10-Year Treasury bond rate Federal Funds Rate Population in five-year age brackets (i.e., Age 10-14, Age 15-19, etc.)
Shoplifting Cases (Percent Change, Actual vs. Predicted) The Economic Model • The economic model actually models the change in shoplifting cases over time instead of the level number of cases. • The equation for the model is expressed this way: • Shoplifting = .17 Unemployment Claims + .06 Savings Rate + .92 Prices Each coefficient is essentially an elasticity measure that tells how much shoplifting will increase for each percent increase in the explanatory variable. For example, a 10% increase in unemployment claims would be expected to increase shoplifting by 1.7%. 20% 15% Predicted Actual 10% 5% 0% 1969 1971 1973 1975 1977 1979 1981 1983 1985 1987 1989 1991 1993 1995 1997 1999 2001 -5% -10% Source: FBI Uniform Crime Reports and Retail Forward Inc.
Unemployment Claims (average monthly claims in thousands) Prices in Retail Channels Excluding Autos (Percent Change) 700 12% 600 10% 500 8% 400 12 6% 300 10 4% 200 8 2% 100 0% 6 1970 1980 1990 2000 - 1975 1985 1995 1975 1970 1980 1985 1990 1995 2000 -2% 4 2 0 1970 1975 1980 1985 1990 1995 2000 The Key Drivers Saving Rate Source: U.S Bureau of Labor Statistics and Retail Forward Inc. Source: U.S Bureau of Economic Analysis and Retail Forward Inc. Source: U.S Bureau of Economic Analysis and Retail Forward Inc. Each spike in unemployment claims during a recession is associated with an increase in shoplifting. As claims now reach 1991 recession levels, shoplifting should be pushed higher. The recent falloff in shoplifting coincided with a big decline in the saving rate as incomes and wealth soared. As households tighten their belts again, shoplifting should be pushed higher. Shoplifting tends to rise amid high inflation as goods are priced out of consumers’ reach. As the recent tame price environment continues, shoplifting should not be pushed higher by price pressures.
Age Distribution of Theft Arrests in 2000 35% 30% 30% 25% 20% 15% 15% 12% 9% 9% 9% 10% 7% 4% 5% 2% 1% 1% 1% 0% 0% Under 10 10-14 15-19 20-24 25-29 30-34 35-39 40-44 45-49 50-54 55-59 60-64 65 plus Population as a Driver Although a population variable was not among the key explanatory variables, the modeling generally showed a positive relationship between shoplifting and the age brackets under age 35 – and conversely a negative relationship between shoplifting and the age brackets above age 45. The link between shoplifting and age is also evident in the age distribution of persons arrested for theft. Persons between the ages of 15 and 24 represented the highest share of persons arrested for theft in 2000. Source: FBI Uniform Crime Reports and Retail Forward Inc.
Population Age 15 to 24 45,000 40,000 35,000 30,000 25,000 20,000 15,000 10,000 5,000 - 1968 1970 1972 1974 1976 1978 1980 1982 1984 1986 1988 1990 1992 1994 1996 1998 2000 2002 Source: U.S. Bureau of Census and Retail Forward Inc. The Threat from Ages 15-24 The potential threat represented by the population of persons age 15 to 24 is growing. In recent years the numbers in this group have begun to grow as the Echo Boom, the children of the Baby Boom, reach their teen years. As a result, this growing youth population represents another factor that should increase inventory shrinkage from shoplifting in the coming years.