Download
1 / 1
10 likes | 277 Views
Fill Rates wholesaler and manufacturers. 100.00%. 98.00%. 96.00 %. 94.00%. 92.00%. 90.00%. 88.00%. Jul. Jun. Jan. Mar. Apr. Feb. Aug. May. wholesaler. January - September 2006. manufacturers. Tsui M, 1 Wilson DI, 2,3 Merry H, 4 Phulwani K, 1 Dooley MJ 1,5

E N D
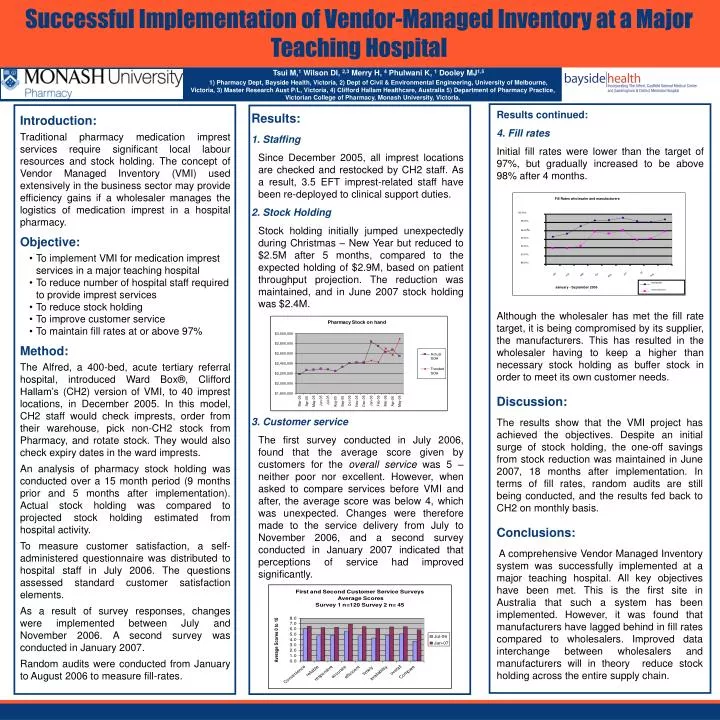
Fill Rates wholesaler and manufacturers 100.00% 98.00% 96.00% 94.00% 92.00% 90.00% 88.00% Jul Jun Jan Mar Apr Feb Aug May wholesaler January - September 2006 manufacturers Tsui M,1 Wilson DI, 2,3 Merry H, 4 Phulwani K, 1 Dooley MJ1,5 1) Pharmacy Dept, Bayside Health, Victoria, 2) Dept of Civil & Environmental Engineering, University of Melbourne, Victoria, 3) Master Research Aust P/L, Victoria, 4) Clifford Hallam Healthcare, Australia 5) Department of Pharmacy Practice, Victorian College of Pharmacy, Monash University, Victoria. Results continued: 4. Fill rates Initial fill rates were lower than the target of 97%, but gradually increased to be above 98% after 4 months. Although the wholesaler has met the fill rate target, it is being compromised by its supplier, the manufacturers. This has resulted in the wholesaler having to keep a higher than necessary stock holding as buffer stock in order to meet its own customer needs. Results: 1. Staffing Since December 2005, all imprest locations are checked and restocked by CH2 staff. As a result, 3.5 EFT imprest-related staff have been re-deployed to clinical support duties. 2. Stock Holding Stock holding initially jumped unexpectedly during Christmas – New Year but reduced to $2.5M after 5 months, compared to the expected holding of $2.9M, based on patient throughput projection. The reduction was maintained, and in June 2007 stock holding was $2.4M. 3. Customer service The first survey conducted in July 2006, found that the average score given by customers for the overall service was 5 – neither poor nor excellent. However, when asked to compare services before VMI and after, the average score was below 4, which was unexpected. Changes were therefore made to the service delivery from July to November 2006, and a second survey conducted in January 2007 indicated that perceptions of service had improved significantly. • Introduction: • Traditional pharmacy medication imprest services require significant local labour resources and stock holding. The concept of Vendor Managed Inventory (VMI) used extensively in the business sector may provide efficiency gains if a wholesaler manages the logistics of medication imprest in a hospital pharmacy. • Objective: • To implement VMI for medication imprest services in a major teaching hospital • To reduce number of hospital staff required to provide imprest services • To reduce stock holding • To improve customer service • To maintain fill rates at or above 97% • Method: • The Alfred, a 400-bed, acute tertiary referral hospital, introduced Ward Box®, Clifford Hallam’s (CH2) version of VMI, to 40 imprest locations, in December 2005. In this model, CH2 staff would check imprests, order from their warehouse, pick non-CH2 stock from Pharmacy, and rotate stock. They would also check expiry dates in the ward imprests. • An analysis of pharmacy stock holding was conducted over a 15 month period (9 months prior and 5 months after implementation). Actual stock holding was compared to projected stock holding estimated from hospital activity. • To measure customer satisfaction, a self-administered questionnaire was distributed to hospital staff in July 2006. The questions assessed standard customer satisfaction elements. • As a result of survey responses, changes were implemented between July and November 2006. A second survey was conducted in January 2007. • Random audits were conducted from January to August 2006 to measure fill-rates. Successful Implementation of Vendor-Managed Inventory at a Major Teaching Hospital Discussion: The results show that the VMI project has achieved the objectives. Despite an initial surge of stock holding, the one-off savings from stock reduction was maintained in June 2007, 18 months after implementation. In terms of fill rates, random audits are still being conducted, and the results fed back to CH2 on monthly basis. Conclusions: A comprehensive Vendor Managed Inventory system was successfully implemented at a major teaching hospital. All key objectives have been met. This is the first site in Australia that such a system has been implemented. However, it was found that manufacturers have lagged behind in fill rates compared to wholesalers. Improved data interchange between wholesalers and manufacturers will in theory reduce stock holding across the entire supply chain.