Download
1 / 47
470 likes | 604 Views
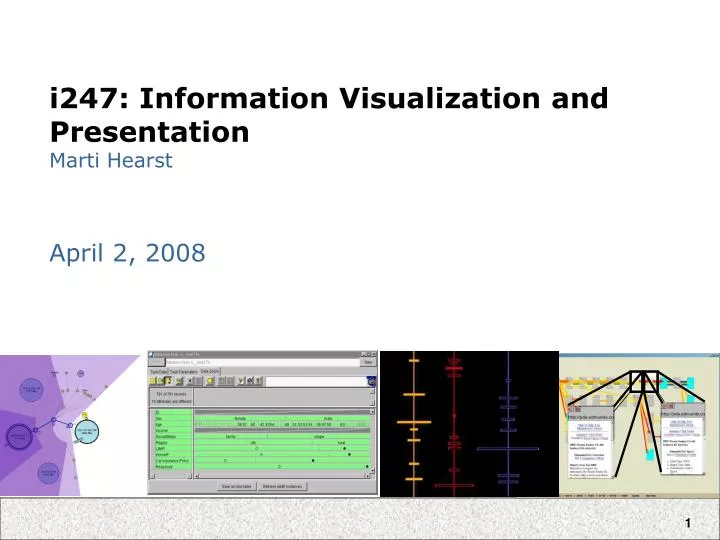
i247: Information Visualization and Presentation Marti Hearst. April 2, 2008. Today: Visualizing Networks. Networks/graphs vs trees Algorithms for network layout Multidimensional networks A new toolkit. Graph and Tree Data Structures. Graphs :

E N D
i247: Information Visualization and PresentationMarti Hearst April 2, 2008
Today: Visualizing Networks • Networks/graphs vs trees • Algorithms for network layout • Multidimensional networks • A new toolkit
Graph and Tree Data Structures • Graphs: • Representations of structured, connected data • Consist of a set of nodes (data) and a set of edges (relations) • Edges can be directed or undirected • Trees: • Graphs with a specific structure • connected graph with n-1 edges • Representations of data with natural hierarchy • Nodes are either parents or children
When is Graph Visualization Applicable? • Ask the question: is there an inherent relation among the data elements to be visualized? • If YES – then the data can be represented by nodes of a graph, with edges representing the relations. • If NO – then the data elements are “unstructured” and goal is to use visualization to analyze and discover relationships among data. Source: Herman, Graph Visualization and Navigation in Information Visualization: a Survey Slide adapted from Jeff Heer
Common Applications • Process Visualization (e.g., Visio) • Dependency Graphs • Biological Interactions (Genes, Proteins) • Computer Networks • Social Networks • Simulation and Modeling Slide adapted from Jeff Heer
Graph Layout • How to position the nodes and edges? • The primary concern with networks • while inheriting other issues such as color, size, etc • The topic of the Graph Drawing conference (as well as numerous InfoVis papers) and even multiple books. Slide adapted from Jeff Heer
Traditional Graph Drawing poly-line graphs (includes bends) orthogonal drawing planar, straight-line drawing upward drawing of DAGs Slide adapted from Jeff Heer
Traditional Graph Drawing • Optimization based on a set of criteria • (mathematical aesthetics) • Minimize edge crossings • Minimize area • Maximize smallest angle • Maximize symmetry • BUT, can’t do all at once • Often unsuitable for interactive visualization • Many optimizations are NP-Hard (runs ~forever) • Approximation algorithms very complex • Unless you only need to compute layout once • Precompute layout, or compute once at the beginning of an application then support interaction Slide adapted from Jeff Heer
Layout Approaches • Tree-ify the graph - then use tree layout • Hierarchical graph layout • Radial graph layout • Optimization-based techniques • Includes spring-embedding / force-directed layout • Adjacency matrices • Structurally-independent layout • On-demand revealing of subgraphs • Distortion-based views • Hyperbolic browser • (this list is not meant to be exhaustive) Slide adapted from Jeff Heer
Tree-based graph layout • Select a tree-structure out of the graph • Breadth-first-search tree • Minimum spanning tree • Other domain-specific structures • Use a tree layout algorithm • Benefits • Fast, supports interaction and refinement • Drawbacks • Limited range of layouts Slide adapted from Jeff Heer
Tree-ify the graph Slide adapted from Jeff Heer
Hierarchical graph layout • Use directed structure of graph to inform layout • Order the graph into distinct levels • this determines one dimension • Now optimize within levels • determines the second dimension • minimize edge crossings, etc • The method used in graphviz’s “dot” algorithm • Great for directed acyclic graphs, but often misleading in the case of cycles Slide adapted from Jeff Heer
Hierarchical Graph Layout • Evolution of the UNIX operating system • Hierarchical layering based on descent Slide adapted from Jeff Heer
Hierarchical graph layout Gnutella network Slide adapted from Jeff Heer
Radial Layout • Animated Exploration of Graphs with Radial Layout, Yee et al., 2001 • Gnutella network
Optimization-based layout • Specify constraints for layout • Series of mathematical equations • Hand to “solver” which tries to optimize the constraints • Examples • Minimize edge crossings, line bends, etc • Multi-dimensional scaling (preserve multi-dim distance) • Force-directed placement (use physics metaphor) • Benefits • General applicability • Often customizable by adding new constraints • Drawbacks • Approximate constraint satisfaction • Running time; “organic” look not always desired Slide adapted from Jeff Heer
Example: Force-Directed Layout Uses physics model to layout graph, Nodes repel each other, edges act as springs, and some amount of friction or drag force is used. Special techniques to dampen “jitter”. visual wordnet http://www.kylescholz.com/projects/wordnet visuwords http://www.visuwords.com/ Slide adapted from Jeff Heer
Typical Sugiyama layout (dot) - preserves tree structure Alternative method - preserves uniform edge lengths slide borrowed from Tim Dwyer
slide borrowed from Tim Dwyer Examples Slide adapted from Jeff Heer
Adjacency Matrices • So far, only looked at node-link diagrams • Often doesn’t scale well due to edge-crossings, occlusion, etc. --> hard to read • One solution: adjacency matrix • show graph as table • nodes as rows/columns • edges as table cells Slide adapted from Jeff Heer
Matrices http://www.informaworld.com/smpp/content~content=a789632485~db=all 20 Years of Four HCI Conferences: A Visual Exploration Henry et al. IJHCI 2007
Matrices with Submatrices • http://www.informaworld.com/smpp/content~content=a789632485~db=all
Using Distortion and Focus + Context • The Hyperbolic Tree Browser The Hyperbolic Browser: A Focus + Context Technique for Visualizing Large Hierarchies, Lamping & Rao, CHI 1996. • http://www.inxight.com/products/sdks/st/ • Uses non-Euclidean geometry as basis of focus + context technique • The hyperbolic browser is a projection into a Euclidean space – a circle • The circumference of a circle increases at a linearly with radius (2 PI) • The circumference of a circle in hyperbolic space increases exponentially • Exponential growth in space available with linear growth of radius • Makes tree layout easy • Size of objects decreases with growth of radius • Reduces expense of drawing trees when cut-off at one pixel
Appearance of Initial Layout • Root mapped at center • Multiple generations of children mapped out towards edge of circle • Drawing of nodes cuts off when less than one pixel
User orientation on refocus • Problem • Hyperbolic Geometry can allow disorienting rotations of objects when refocusing • Solution one: • Preserve initial angular orientation of parent to child nodes • Solution two: • Preserve left to right orientation of parent to child nodes beginning with initial display
User orientations - Solutions Preserving Angular Orientation Left to Right Ordering
Structurally-Independent Layout • Ignore the graph structure. • Base the layout on other attributes of the data • Examples: • Geography • Time • Benefits • Often very quick layout • Optimizes communication of particular features • Drawbacks • May or may not present structure well Slide adapted from Jeff Heer
Structurally Independent Layout • The “Skitter” Layout • Internet Connectivity • Angle = Longitude • geography • Radius = Degree • # of connections http://www.caida.org/research/topology/as_core_network/2007/images/ascore-simple.2007_big.png Skitter, www.caida.org Slide adapted from Jeff Heer
Progressive Disclosure • Only show subsets that are currently selected • http://www.theyrule.net/ • http://kylescholz.com/projects/wordnet/wordnet2.html
Problem: Multivariate Graphs • What if you want to associate information with the nodes and edges? • Typical approach: vary • Size of nodes • Color of nodes • Fatness of edges • Colors of edges • However, it’s hard to make quantitative comparisons when these retinal cues are spread throughout the graph.
Solution: Wattenberg’s Pivot Graphs • Use “roll-up” idea from OLAP to compress and re-express graph data. • Aggregate all nodes that have the same values on each of those dimensions, and aggregate edges accordingly. • In graph below, F = Female, M = Male, Numbers mean counts Visual Exploration of Multivariate Graphs, Wattenberg, IEEE Infoviz ???
Multidimensional Pivot Graphs • What is added, and what is lost, from this transformation?
Issues with Pivot Graphs • Disconnected components may become connected • Acyclic graphs may obtain cycles
A new toolkit! • Networks for excel by Marc Smith et al. at Microsoft research • Called .netmap • Requires windows-specific software • (Search on “excel .netmap”)
.NetMap: Edges Worksheet Slide courtesy Marc Smith
.NetMap: Vertices Worksheet Slide courtesy Marc Smith
Marc’s Facebook Graph Slide courtesy Marc Smith
Social Action – Adam Perer Slide courtesy Marc Smith
Summary • Networks are a big topic! • Many approaches to layout. • New ideas still coming all the time.