Download
1 / 38
380 likes | 501 Views
RtI and Project MORE Granby Elementary “Where ALL Students Come To Grow”. District Goals. By 2013, WCS will reduce the number of students achieving below proficient in reading by 10% annually in LEP and SWD subgroups. How did we get these results?. The Leadership and Learning Matrix.

E N D
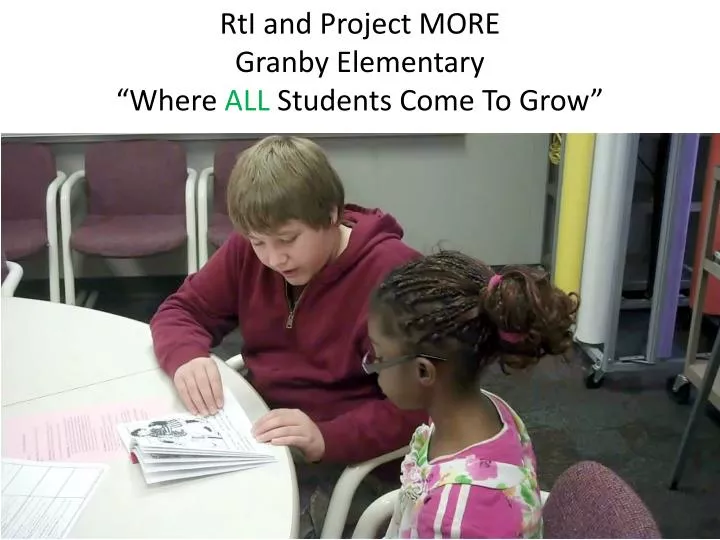
RtI and Project MORE Granby Elementary “Where ALL Students Come To Grow”
District Goals By 2013, WCS will reduce the number of students achieving below proficient in reading by 10% annually in LEP and SWD subgroups.
Howdid we get these results? The Leadership and Learning Matrix Organizational Results Antecedents of Excellence • The vertical axis represents the results the organization wants to achieve. • The horizontal axis represents the degree to which the leader understands the causes of the results. Reeves, D. (2002) The Leaders Guide to Standards. San Francisco: Jossey-Bass.
Change our Focus to Growth • WHY? • Looking at proficiency, it was hard to see a problem • Focusing on growth will produce proficiency but focusing on proficiency will not necessarily produce growth • We don’t want to reach for a specific bar, but rather have ALL KIDS continue to show growth regardless of where they started
Instructional Leadership 1st Improve Here Our CoreBusiness Instruction = Our Product Student Learning = To Improve Here
Teachers & Students Like a picture “snapshot,” a data “snapshot” is a conversation starter.
A Year’s Growth For ALL and Accelerated Growth for BehindProficiency + Growth = Success FOR All The Journey with NWEA MAP in Worthington Schools Jas, Elementary Principal
21 5
Identify Class Scatterplot Leading Lucky Losing Ground Learning
Identify Class Bubble Chart The larger the bubble, the larger the growth. Blue is positive growth, and grayish white is negative growth. Students of concern
Intervene Tier 1 flexible grouping
Tiers @ Granby • Tier 1 Instruction – Provide researched based best practices to ensure 80%+ growth for class • Tier 2 Intervention Examples: • Project MORE (60 students) • LLI (Leveled Literacy Intervention) • Reading Recovery • Tier 3 – Increase Frequency (how often) and/or Intensity (time) or Wilson Reading
Tier 1 – Benchmark • Student is progressing at grade level. • All instruction delivered within the reading block in the regular class setting using the core curriculum. • Student is progress monitored through the standard district-wide assessments three times per year. (Measures of Academic Progress; MAP) • Student consistently scores at or above grade level on testing. • 80+% of students fall in this category.
Tier II – 30-Minute Intervention • Student requires extra support to progress at grade level. • Student receives a moderate or high risk score on MAP, DIBELS, STAR, and/or district grade level benchmarks. • Student receives 30 minutes of specific skill instruction. This is in addition to the regular classroom instruction provided for all students. This service is in a small intervention group setting and/or one on one Project MORE instruction. This results in a total of 90-120 minutes additional reading instruction weekly. • Student receives Ongoing Progress Monitoring. • Intervention group instruction occurs with a maximum of 6 weeks per skill. • Classroom teacher, Reading Specialist, and Principal meet monthy to review student data and make decisions about interventions provided for individual students.
Tier II – Action Plan • If student shows minimal or no progress following 6 weeks of daily intervention instruction. AND student is at moderate to high risk on MAP, DIBELS, STAR, and/or district grade level benchmarks. • In most cases, classroom teacher initiates an IAT/parent conference. See Example Folder • Guidance will notify teachers, parents, and administration if IAT conference is scheduled. • Reading Specialist completes additional assessments such as DRA word analysis and LLI (leveled literacy intervention) applicable assessments to provide additional documentation for IAT meeting. • IAT meeting scheduled by Guidance.
IAT Process Intervention Assistance Team
Inside Blue Folder • IAT Scheduling Form • IAT Request Form • IAT Plan Form • IAT Follow-up Form
Intervene Identify relative strengths and areas for growth. Students self-assess “school behaviors.”
1 6
Communication w/ Teaching Staff • Weekly Team Planning w/ Administration • Monthly Data Review with Building Data Team • Professional Development Around Improving Instruction (tier 1) • Weekly Progress Monitoring (Common Formative Assessments) • RtI/IAT review and development • Co-Teaching during Inclusion • Reading, Math, and Science Articulation • Scheduled Intervention Period
RtI and Project MORE Granby Elementary “Where ALL Students Come To Grow”