Download
1 / 1
10 likes | 204 Views
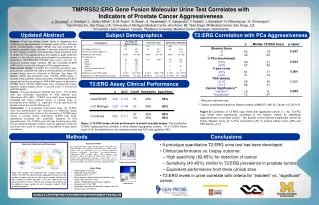
San Diego VA. San Diego. Université Laval . Universitiy of Michigan. Demographics. Medical Center . n. Median T2:ERG Score. p value*. n. 115. 213. 228. Gleason Score. No. biopsy positive (%). 49. 43%. 92. 43%. 85. 37%. £. 0.033. 6. 52. 19. Previously negative biopsy (%).

E N D
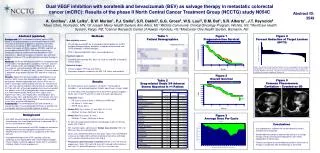
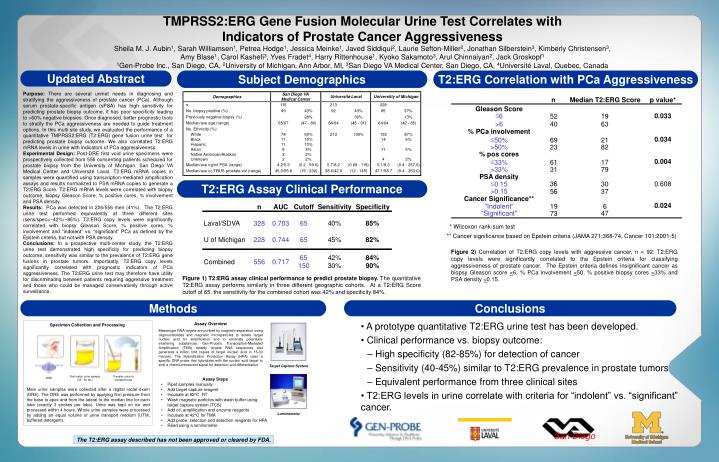
San Diego VA San Diego Université Laval Universitiy of Michigan Demographics Medical Center n Median T2:ERG Score p value* n 115 213 228 Gleason Score No. biopsy positive (%) 49 43% 92 43% 85 37% £ 0.033 6 52 19 Previously negative biopsy (%) 28% 39% 13% Median/ave age (range) 65/67 (47 - 86) 64/64 (45 - 91) 64/64 (42 - 85) >6 40 63 No. Ethnicity (%): % PCa involvement White 78 69% 213 100% 193 87% 0.034 £ Black 11 10% 14 6% 69 21 50% Hispanic 11 10% >50% 23 82 Asian 9 8% 11 5% % pos cores Native American/Alaskan 2 2% Unknown 2 2% 4 2% 0.004 £ 61 17 33% Median/ave ng/ml PSA (range) 4.2/5.3 (0.2 - 59.6) 5.7/8.2 (0.68 - 118) 5.1/8.3 (0.4 - 257.6) >33% 31 79 Median/ave cc TRUS prostate vol (range) 45.0/55.6 (19 - 232) 38.0/42.0 (12 - 145) 47.1/58.7 (9.4 - 253.0) PSA density £ 36 0.608 30 0.15 >0.15 56 37 Cancer Significance** 0.024 "Indolent" 6 19 "Significant" 47 73 n AUC Cutoff Sensitivity Specificity * Wilcoxon rank - sum test Laval/SDVA 328 0.703 65 40% 85% ** Cancer significance based on Epstein criteria (JAMA 271:368-74, Cancer 101:2001-5) U of Michigan 228 0.744 65 45% 82% 65 42% 84% Combined 556 0.717 150 30% 90% First-catch urine sample (25 - 30 mL) Transfer urine to transport tube DRE TMPRSS2:ERG Gene Fusion Molecular Urine Test Correlates with Indicators of Prostate Cancer AggressivenessSheila M. J. Aubin1, Sarah Williamsen1, Petrea Hodge1, Jessica Meinke1, Javed Siddiqui2, Laurie Sefton-Miller2, Jonathan Silberstein3, Kimberly Christensen3, Amy Blase1, Carol Kashefi3, Yves Fradet4, Harry Rittenhouse1, Kyoko Sakamoto3, Arul Chinnaiyan2, Jack Groskopf1 1Gen-Probe Inc., San Diego, CA, 2University of Michigan, Ann Arbor, MI, 3San Diego VA Medical Center, San Diego, CA, 4Université Laval, Quebec, Canada Updated Abstract Subject Demographics T2:ERG Correlation with PCa Aggressiveness Purpose: There are several unmet needs in diagnosing and stratifying the aggressiveness of prostate cancer (PCa). Although serum prostate-specific antigen (sPSA) has high sensitivity for predicting prostate biopsy outcome, it has poor specificity leading to >60% negative biopsies. Once diagnosed, better prognostic tools to stratify the PCa aggressiveness are needed to guide treatment options. In this multi-site study, we evaluated the performance of a quantitative TMPRSS2:ERG (T2:ERG) gene fusion urine test for predicting prostate biopsy outcome. We also correlated T2:ERG mRNA levels in urine with indicators of PCa aggressiveness. Experimental Design: Post-DRE first void urine specimens were prospectively collected from 556 consenting patients scheduled for prostate biopsy from the University of Michigan, San Diego VA Medical Center and Université Laval. T2:ERG mRNA copies in samples were quantified using transcription-mediated amplification assays and results normalized to PSA mRNA copies to generate a T2:ERG Score. T2:ERG mRNA levels were correlated with biopsy outcome, biopsy Gleason Score, % positive cores, % involvement and PSA density. Results: PCa was detected in 226/556 men (41%). The T2:ERG urine test performed equivalently at three different sites (sens/spec=~42%/~85%). T2:ERG copy levels were significantly correlated with biopsy Gleason Score, % positive cores, % involvement and “indolent” vs. “significant” PCa as defined by the Epstein criteria, but not with PSA density. Conclusions: In a prospective multi-center study, the T2:ERG urine test demonstrated high specificity for predicting biopsy outcome; sensitivity was similar to the prevalence of T2:ERG gene fusions in prostate tumors. Importantly, T2:ERG copy levels significantly correlated with prognostic indicators of PCa aggressiveness. The T2:ERG urine test may therefore have utility for discriminating between patients requiring aggressive treatment and those who could be managed conservatively through active surveillance. T2:ERG Assay Clinical Performance Figure 2) Correlation of T2:ERG copy levels with aggressive cancer, n = 92: T2:ERG copy levels were significantly correlated to the Epstein criteria for classifying aggressiveness of prostate cancer. The Epstein criteria defines insignificant cancer as biopsy Gleason score <6, % PCa involvement <50, % positive biopsy cores <33% and PSA density <0.15. Figure 1) T2:ERG assay clinical performance to predict prostate biopsy. The quantitative T2:ERG assay performs similarly in three different geographic cohorts. At a T2:ERG Score cutoff of 65, the sensitivity for the combined cohort was 42% and specificity 84%. Methods Conclusions • A prototype quantitative T2:ERG urine test has been developed. • Clinical performance vs. biopsy outcome: • High specificity (82-85%) for detection of cancer • Sensitivity (40-45%) similar to T2:ERG prevalence in prostate tumors • Equivalent performance from three clinical sites • T2:ERG levels in urine correlate with criteria for “indolent” vs. “significant” cancer. Assay Overview Messenger RNA targets are purified by magnetic separation using oligonucleotides and magnetic microparticles to isolate target nucleic acid for amplification and to eliminate potentially interfering substances. Gen-Probe's Transcription-Mediated Amplification (TMA) reliably targets RNA sequences and generates a billion fold copies of target nucleic acid in 15-30 minutes. The Hybridization Protection Assay (HPA) uses a specific DNA probe that hybridizes with the nucleic acid target to emit a chemiluminescent signal for detection and differentiation. Specimen Collection and Processing Target Capture System • Assay Steps • Pipet samples manually • Add target capture reagent • Incubate at 62°C, RT • Wash magnetic particles with wash buffer using target capture system (TCS) • Add oil, amplification and enzyme reagents • Incubate at 42°C for TMA • Add probe, selection and detection reagents for HPA • Read using a luminometer Male urine samples were collected after a digital rectal exam (DRE). The DRE was performed by applying firm pressure from the base to apex and from the lateral to the median line for each lobe (exactly 3 strokes per lobe). Urine was kept on ice and processed within 4 hours. Whole urine samples were processed by adding an equal volume of urine transport medium (UTM, buffered detergent). Luminometer The T2:ERG assay described has not been approved or cleared by FDA.