Download
1 / 55
630 likes | 916 Views
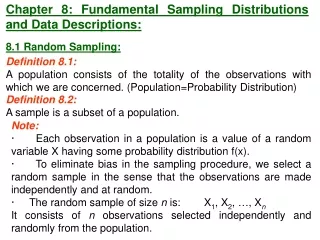
Chapter 8 Sampling Distributions Mean and Proportion. Sample. Population. Goal of Statistical Analysis: Find Parameters of Population from Statistics on Sample. Random Sampling: every unit in the population has an equal chance to be chosen The quality of all statistical

E N D
Sample Population Goal of Statistical Analysis: Find Parameters of Population from Statistics on Sample • Random Sampling: every unit in the • population has an equal chance to be • chosen • The quality of all statistical • analysis depends on the quality • of the sample data
Parameter: A number describing a population. • Statistic: A number describing a sample. • A random sample should represent the population well, so sample statistics from a random sample should provide reasonable estimates of population parameters. • All sample statistics have some error in estimating population parameters. • If repeated samples are taken from a population and the same statistic (e.g. mean) is calculated from each sample, the statistics will vary, that is, they will have a distribution. • A larger sample provides more information than a smaller sample so a statistic from a large sample should have less error than a statistic from a small sample.
Sampling distributions for: • Mean (8.1) • (mean of a parameter in a population or EVave) • Proportion (8.2) • (percentage of a parameter in a population or EV%)
Statistics such as are random variables since their value varies from sample to sample. So they have probability distributions associated with them. In this chapter we focus on the shape, center and spread of statistics such as .
The sampling distribution of a statistic is a probability distribution for all possible values of the statistic computed from a sample of size n. The sampling distribution of the sample mean is the probability distribution of all possible values of the random variable computed from a sample of size n from a population with mean and standard deviation .
Example 1: Sampling Distribution of the Sample Mean-Normal Population The weights of pennies minted after 1982 are approximately normally distributed with mean 2.46 grams and standard deviation 0.02 grams. Approximate the sampling distribution of the sample mean by obtaining 200 simple random samples of size n = 5 from this population.
The data on the following slide represent the sample means for the 200 simple random samples of size n = 5. For example, the first sample of n = 5 had the following data: 2.493 2.466 2.473 2.492 2.471 Note: =2.479 for this sample
The mean of the 200 sample means is 2.46, the same as the mean of the population. The standard deviation of the sample means is 0.0086, which is smaller than the standard deviation of the population. The next slide shows the histogram of the sample means.
What role does n, the sample size, play in the standard deviation of the distribution of the sample mean?
What role does n, the sample size, play in the standard deviation of the distribution of the sample mean? As the size of the sample gets larger, we do not expect as much spread in the sample means since larger observations will offset smaller observations.
The Mean and Standard Deviation of the Sampling Distribution of Suppose that a simple random sample of size n is drawn from a large population with mean and standard deviation . The sampling distribution of will have mean and standard deviation . The standard deviation of the sampling distribution is called the standard error of the mean and is denoted .
µx=µ x= n Notation the mean of the sample means the standard deviation of sample mean (often called the standard error of the mean)
Example – Weight of pennies The weights of pennies minted after 1982 are approximately normally distributed with mean 2.46 grams and standard deviation 0.02 grams. What is the probability that in a simple random sample of 10 pennies minted after 1982, we obtain a sample mean of at least 2.465 grams?
Solution • is normally distributed with =2.46 and . • . • P(Z>0.79)=1-0.7852 =0.2148. On CALCULATOR: P(x>2.465)=normalcdf(2.465,10^99,2.46,0.0063)=0.2148
Given the population of passengers has normally distributed weights with a mean of 172 lb and a standard deviation of 29 lb, a) if one man is randomly selected, find the probability that his weight is greater than 175 lb.b) if 20 different men are randomly selected, find the probability that their mean weight is greater than 175 lb Another Example – Water Taxi (work on your own)
Or use table: z = 175 – 172 = 0.10 29 Ans a) if one man is randomly selected, find the probability that his weight is greater than 175 lb: CALCULATOR: P(X>175)=normalcdf(175,10^99,172,29)
Or use table: z = 175 – 172 = 0.46 29 20 Ans – cont b) if 20 different men are randomly selected, find the probability that their mean weight is greater than 172 lb. CALCULATOR: P(X>175)=normalcdf(175,10^99,172,29/ 20 )
b) if 20 different men are randomly selected, their mean weight is greater than 175 lb.P(x > 175) = 0.3228 Ans - conclusion a) if one man is randomly selected, find the probability that his weight is greater than 175 lb.P(x > 175) = 0.4602 It is much easier for an individual to deviate from the mean than it is for a group of 20 to deviate from the mean.
EXAMPLE: Sampling from a Population that is Not Normal The following table and histogram give the probability distribution for rolling a fair die: =3.5, =1.708 Note that the population distribution is NOT normal
Estimate the sampling distribution of (average of n tosses of the die) by obtaining 200 simple random samples of size n=4 and calculating the sample mean for each of the 200 samples. Repeat for n = 10 and 30. Histograms of the sampling distribution of the sample mean for each sample size are given on the next slide.
Central Limit Theorem The random variable x has a distribution (which may or may not be normal) with mean µ and standard deviation . Simple random samples all of size n are selected from the population. (The samples are selected so that all possible samples of the same size n have the same chance of being selected.) Given: 1. The distribution of sample x will, as the sample size increases, approach a normal distribution. 2. The mean of the sample means is the population mean µ. 3. The standard deviation of all sample means is n
Key Points • The mean of the sampling distribution is equal to the mean of the parent population and the standard deviation of the sampling distribution of the sample mean is regardless of the sample size. • The shape of the distribution of the sample mean becomes approximately normal as the sample size n increases, regardless of the shape of the population: This is a result of The Central Limit Theorem. As the sample size increases, the sampling distribution of sample means approaches a normal distribution.
Practical Rules For samples of size n larger than 30, the distribution of the sample means can be approximated reasonably well by a normal distribution. The approximation gets better as the sample size n becomes larger. 2. If the original population is itself normally distributed, then the sample means will be normally distributed for any sample size n (not just the values of n larger than 30).
Example : (Using the Central Limit Theorem) • Suppose that the mean time for an oil change at a “10-minute oil change joint” is 11.4 minutes with a standard deviation of 3.2 minutes. • If a random sample of n = 35 oil changes is selected, describe the sampling distribution of the sample mean. • (b) If a random sample of n = 35 oil changes is selected, what is the probability the mean oil change time is less than 11 minutes?
Example : (Using the Central Limit Theorem) Suppose that the mean time for an oil change at a “10-minute oil change joint” is 11.4 minutes with a standard deviation of 3.2 minutes. If a random sample of n = 35 oil changes is selected, describe the sampling distribution of the sample mean. (b) If a random sample of n = 35 oil changes is selected, what is the probability the mean oil change time is less than 11 minutes? Solution: is approximately normally distributed with mean=11.4 and std. dev. = . • Solution: , P(Z<-0.74)=0.23.
Point Estimate of a Population Proportion Suppose that a random sample of size n is obtained from a population in which each individual either does or does not have a certain characteristic. The sample proportion, denoted (read “p-hat”) is given by where x is the number of individuals in the sample with the specified characteristic. The sample proportion is a statistic that estimates the population proportion, p.
Example 1: Computing a Sample Proportion In a Quinnipiac University Poll conducted in May of 2008, 1,745 registered voters nationwide were asked whether they approved of the way George W. Bush was handling the economy. 349 responded “yes”. Obtain a point estimate for the proportion of registered voters who approved of the way George W. Bush was handling the economy.
Example 1: Computing a Sample Proportion In a Quinnipiac University Poll conducted in May of 2008, 1,745 registered voters nationwide were asked whether they approved of the way George W. Bush was handling the economy. 349 responded “yes”. Obtain a point estimate for the proportion of registered voters who approved of the way George W. Bush was handling the economy. Solution:
Example 2: Using Simulation to Describe the Distribution of the Sample Proportion According to a Time poll conducted in June of 2008, 42% of registered voters believed that gay and lesbian couples should be allowed to marry. Describe the sampling distribution of the sample proportion for samples of size n=10, 50, 100.
Key Points from Example 2 • Shape: As the size of the sample, n, increases, the shape of the sampling distribution of the sample proportion becomes approximately normal. • Center: The mean of the sampling distribution of the sample proportion equals the population proportion, p. • Spread:The standard deviation of the sampling distribution of the sample proportion decreases as the sample size, n, increases.
Sampling Distribution of For a simple random sample of size n with population proportion p: • The shape of the sampling distribution of is approximately normal provided np(1-p)≥10. • The mean of the sampling distribution of is • The standard deviation of the sampling distribution of is
Sampling Distribution of • The model on the previous slides requires that the sampled values are independent. When sampling from finite populations, this assumption is verified by checking that the sample size n is no more than 5% of the population size N (n ≤ 0.05N). • Regardless of whether np(1-p) ≥10 or not, the mean of the sampling distribution of is p, and the standard deviation is
Example 3: According to a Time poll conducted in June of 2008, 42% of registered voters believed that gay and lesbian couples should be allowed to marry. Suppose that we obtain a simple random sample of 50 voters and determine which believe that gay and lesbian couples should be allowed to marry. Describe the sampling distribution of the sample proportion.
Solution The sample of n=50 is smaller than 5% of the population size (all registered voters in the U.S.). Also, np(1-p)=50(0.42)(0.58)=12.18≥10. The sampling distribution of the sample proportion is therefore approximately normal with mean=0.42 and standard deviation=
Example 4: Compute Probabilities of a Sample Proportion According to the Centers for Disease Control and Prevention, 18.8% of school-aged children, aged 6-11 years were overweight in 2004. • In a random sample of 90 school children aged 6-11 years what is the probability that at least 19% are overweight? • Suppose in one random sample of 90 school children aged 6-11 years there were 24 overweight children. What might you conclude?
Solution • n=90 is less than 5% of the population size • np(1-p)=90(.188)(1-.188)≈13.7≥10 • is approximately normal with mean=0.188 and standard deviation = • In a random sample of 90 school-aged children, aged 6-11 years, what is the probability that at least 19% are overweight? Or (CALCULATOR): , P(Z>0.05)=1-0.5199=0.4801 P(X>0.19)=normalcdf(0.19,10^99,0.188,0.0412)=0.4801
Solution • is approximately normal with mean=0.188 and standard deviation = 0.0412 • Suppose in one random sample of 90 school children aged 6-11 years there were 24 overweight children. What might you conclude? , P(X>0.2667)= normalcdf(0.2667,10^99,0.188,0.0412)= 0.028. We would only expect to see about 3 samples in 100 resulting in a sample proportion of 0.2667 or more. This is an unusual sample if the true population proportion is 0.188