Download
1 / 34
350 likes | 359 Views
Chapter 14 Forensic Challenges. Fundamentals of Forensic DNA Typing. Slides prepared by John M. Butler June 2009. Chapter 14 – Forensic Challenges. Chapter Summary

E N D
Chapter 14 Forensic Challenges Fundamentals of Forensic DNA Typing Slides prepared by John M. Butler June 2009
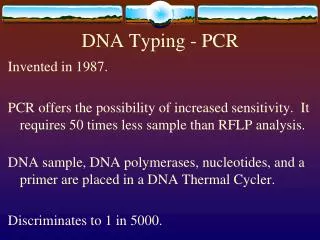
Chapter 14 – Forensic Challenges Chapter Summary DNA can be damaged or destroyed as it is exposed to environmental elements present at crime or disaster scenes. Degraded DNA often results in partial STR profiles or none at all. The use of reduced size PCR products, also known as “miniSTRs”, can in some cases enable recovery of information from degraded DNA or samples containing PCR inhibitors. Mixtures of DNA from two or more sources occur in some crime scenes and resolving the components of a mixture can be challenging in many situations. Depending on the type of mixture obtained including the ratio of contributors, the peak heights of STR alleles observed in a mixture can be used to group alleles to decipher the mixture component genotypes. Low-level DNA analysis, sometimes referred to as “low-copy number” or LCN testing, involves attempting to detect a DNA profile from only a few cells often through boosting the number of PCR cycles to enhance sensitivity. LCN testing is prone to problems, such as allelic drop-out (due to stochastic amplification effects) and allelic drop-in (due to sporadic contamination), and rigorous rules are generally applied including generating composite profiles of replicated alleles from multiple amplifications of the same DNA extract.
(a) Agarose yield gel results Smear of degraded DNA fragments High relative molecular mass DNA in a tight band Good quality DNA Degraded DNA D5S818 D13S317 (b) Degraded DNA sample D7S820 D16S539 Penta D CSF1PO John M. Butler (2009) Fundamentals of Forensic DNA Typing, Figure 14.1
DNA size (bp) relative to an internal size standard (not shown) (a) Full Profile (Good Quality) Relative fluorescence units (RFUs) (b) Partial Profile (Poor Quality) Comparison of Results with Good and Poor Quality DNA John M. Butler (2009) Fundamentals of Forensic DNA Typing, Figure 14.2
(a) miniSTR primer Conventional PCR primer STR repeat region miniSTR primer Conventional PCR primer (b) Conventional STR test (COfiler kit) MiniSTR assay (using Butler et al. 2003 primers) miniSTRs (Reduced size amplicon John M. Butler (2009) Fundamentals of Forensic DNA Typing, Figure 14.3 150 bp smaller
Better DNA extraction/recovery • Continued use of miniSTRs • to improve success rates for recovery of information from compromised DNA evidence • Replicate results for reproducibility • to improve reliability with low-template DNA testing CompromisedSampleImprovements
(a) Single Source D3S1358 TH01 D13S317 D16S539 D2S1338 16,16 9,9.3 8,12 9,9 17,19 (b) Mixed Source D3S1358 TH01 D13S317 D16S539 D2S1338 John M. Butler (2009) Fundamentals of Forensic DNA Typing, Figure 14.4
Type A Type B Type C Different Types of DNA Mixtures According to the German Stain Commission Classification John M. Butler (2009) Fundamentals of Forensic DNA Typing, D.N.A. Box 14.1
Is the sample a mixture? >2 alleles at a locus, except tri-allelics? Single Source DNA Sample NO Likelihood Ratio [LR] Determine STR profile and compute RMP YES YES Assume # Contributors? Mixed DNA Sample Probability of Exclusion [CPE] “RMNE” NO Are # of contributors defined? YES Stochastic Effects ? Possible Low Level DNA) ? Differentiate a Major/Minor Component? NO NO TYPE A A biostatistical analysis must be performed YES YES TYPE B TYPE C A biostatistical analysis should not be performed Determine component profile(s) and compute RMP for major Mixture Classification Flowchart John M. Butler (2009) Fundamentals of Forensic DNA Typing, D.N.A. Box 14.1
Step #1 Identify the Presence of a Mixture Designate Allele Peaks Step #2 Identify the Number of Potential Contributors Step #3 Estimate the Relative Ratio of the Individuals Contributing to the Mixture Step #4 Consider All Possible Genotype Combinations Step #5 Step #6 Compare Reference Samples Steps in the Interpretation of Mixtures Defined by Clayton et al. 1998 John M. Butler (2009) Fundamentals of Forensic DNA Typing, Figure 14.5
Good heterozygote peak balance 100 pg Severe imbalance 50 pg Allele dropout 10 pg Heterozygote Sample Result at a Single STR Locus at Different DNA Amounts John M. Butler (2009) Fundamentals of Forensic DNA Typing, Figure 14.6
Incomplete adenylation Stutter products Tri-allelic pattern Variant allele Variant allele +A +A -A -A 6.0% 7.8% D8S1179 TPOX TH01 D3S1358 D7S820 Some Example Biological Artifacts with STR Markers From Butler, J.M. (2004) Short tandem repeat analysis for human identity testing. Current Protocols in Human Genetics, John Wiley & Sons, Hoboken, NJ, Unit 14.8, (Supplement 41), pp. 14.8.1-14.8.22
Intact sample Target region for PCR 300 base pair PCR product can be produced Degraded sample Target region for PCR is fragmented 300 base pair PCR product can not be produced or only in limited quantities DNA Degradation
“Degraded DNA” (falls apart with high temperatures) AMEL D19 “Decay curve” of degraded DNA D3 TH01 VWA D8 D21 FGA D16 D18 D2 Degraded DNA Larger segments of DNA cannot be recovered when DNA molecules have fragmented into small pieces (caused by heat, water, or bacteria)
With degraded DNA samples, information is simply lost at the larger sized STR loci DNA Degradation Means Less Loci Work 4000 rfu Control (high quality DNA) 600 rfu Much lower peak heights and loss of alleles Degraded
Smaller sized DNA works With degraded DNA samples, information is simply lost at the larger sized STR loci Same DNA with Different Quality 4000 RFUs Full Profile (Good Quality) Signal Strength is Lower Partial Profile (Poor Quality) 600 RFUs Typing “1 ng” degraded DNA
------------4049 or ----301-9------- Impact of Degraded DNA Samples • Comparison to a phone number(string of 13 numbers) 001-301-975-4049 • If you only had “4049”…this information would be of limited value since it is not as specific (and could match other phone numbers from different area codes) • DNA profiles are essentially a string of numbers – if the DNA is damaged, then the string of numbers is shorter and less informative…
(A) miniSTR primer Conventional PCR primer STR repeat region miniSTR primer Conventional PCR primer (B) Conventional STR test (COfiler™ kit) MiniSTR assay (using Butler et al. 2003 primers) miniSTRs: new tool for degraded DNA Smaller PCR products work better with low copy number or fragmented DNA templates 150 bp smaller
100% (a) 85% Heterozygous peak region >70% MIXTURE REGION <15% Stutter region 9% 100% (b) >70% 60% Higher than typical stutter product (>15%) Smaller peak area than normally seen with heterozygote partner alleles(<70%) 25% <15% 10% Wrong side of allele to be typical stutter product
Mixture Basics From J.M. Butler (2005) Forensic DNA Typing, 2nd Edition, p. 154 • Mixtures arise when two or more individuals contribute to the sample being tested. • Mixtures can be challenging to detect and interpret without extensive experience and careful training. • Differential extraction can help distinguish male and female components of many sexual assault mixtures. Even more challenging with poor quality data when degraded DNA is present… Y-chromosome markers can help here in some cases…
major Torres et al. (2003) Forensic Sci. Int. 134:180-186 examined 1,547 cases from 1997-2000 containing 2,424 typed samples of which 163 (6.7%) contained a mixed profile with only 8 (0.3%) coming from more than two contributors minor 95.1% (155/163) were 2-component mixtures More on Mixtures... Ann Gross will discuss some recent collected casework summaries Most mixtures encountered in casework are 2-component mixtures arising from a combination of victim and perpetrator DNA profiles Ratios of the various mixture components stay fairly constant between multiple loci enabling deduction of the profiles for the major and minor components Some mixture interpretation strategies involve using victim (or other reference) alleles to help isolate obligate alleles coming from the unknown portion of the mixture
http://www.cstl.nist.gov/biotech/strbase/interlab/MIX05.htm Amelogenin D8S1179 D21S11 D18S51 Obligate Alleles (not present in the victim reference) Y 12 28 16 True “Perpetrator” Profile X,Y 12,12 28,31.2 15,16 MIX05 Case #1; Profiler Plus green loci Example Mixture Data (MIX05 Study-Profiler Plus) Single Source Sample (Victim) Evidence Mixture (Victim+ Perpetrator) Victim = major Perpetrator = minor
Sources of DNA Mixtures • Two (or more) individuals contribute to the biological evidence examined in a forensic case (e.g., sexual assault with victim and perpetrator or victim, consensual sexual partner, and perp) • Contamination of a single source sample from • evidence collection staff • laboratory staff handling the sample • Low-level DNA in reagents or PCR tubes or pipet tips Victim Reference and Spouse or Boyfriend Reference Examine Staff Profiles (Elimination Database), etc. Reference elimination samples are useful in deciphering both situations due to possibility of intimate sample profile subtraction
http://www.cstl.nist.gov/biotech/strbase/interlab/MIX05.htm MIX05 Case #1; Identifiler green loci Mixture? Mixture? Mixture Mixture Mixture Mixtures: Issues and Challenges From J.M. Butler (2005) Forensic DNA Typing, 2nd Edition, p. 155 • The probability that a mixture will be detected improves with the use of more loci and genetic markers that have a high incidence of heterozygotes. • The detectability of multiple DNA sources in a single sample relates to the ratio of DNA present from each source, the specific combinations of genotypes, and the total amount of DNA amplified. • Some mixtures will not be as easily detectable as other mixtures.
DNA Size (bp) D3S1358 VWA FGA blue panel green panel Amel Relative Fluorescence Units D8S1179 D21S11 D18S51 yellow panel D13S317 D5S818 D7S820
DNA Size (bp) X Y RFUs C B B C B A D A D A C 3 peaks at D8S1179 4 peaks at D21S11 4 peaks at D18S51 amelogenin X-Y peak imbalance
1 = major component 2 = major component A B C AA BC BB AC CC AB AB AC BC AC 1 1 1 1 1 1 2 2 2 2 2 2 AB BC
Mixture Interpretation – A Major Challenge… Not a clear cut answer because DNA result is from multiple contributors
Mixture Sample Locus 1 Locus 2 Locus 3 Locus 4 Locus 5 More than two peaks observed at more than two loci (tested DNA regions) Single Source vs. Mixture Samples Single Source Sample Locus 1 Locus 2 Locus 3 Locus 4 Locus 5 16,16 9,9.3 8,12 9,9 17,19 One or two peaks observed at each locus (tested DNA region) STR LocusLikely “true” genotype for other component D3S1358 14,17 TH01 8,9.3 D13S317 8,10 D16S539 11,12 D2S1338 17,23 Different possible combinations could have given rise to the particular mixture observed
A B C D With Some Mixtures, Multiple Genotype Combinations Are Possible AC BD AB CD BC AD Depends on PHR and proportion of mixture components from the various contributors Peak Height Ratios (PHR) Minimum Peak Height (mPH) Proportion (p) or mixture proportion (Mx)
DEGRADED DNA D5S818 D7S820 D13S317 D16S539 CSF1PO Penta D MIXTURES D3S1358 TH01 D13S317 D16S539 D2S1338 Common Casework Challenges Loss of signal at larger size loci More than two alleles at multiple loci From Butler, J.M. (2004) Short tandem repeat analysis for human identity testing. Current Protocols in Human Genetics, John Wiley & Sons, Hoboken, NJ, Unit 14.8, (Supplement 41), pp. 14.8.1-14.8.22
DNA Testing Has Become Extremely Sensitive… • What does it mean to obtain a DNA match between a suspect and material from a crime scene? • Is the fact that a DNA profile obtained mean that this information is probative? • More complicated samples (mixtures) and more items per case being submitted to labs
Crime Event Potential to “Contaminate” Analysis completed Laboratory analysis Opportunity for Adventitious Transfer Investigators arrive, detect, and recover evidentiary material Discovery Opportunity for DNA Transfer from Perpetrator Time Line Showing the Potential for DNA Deposition/Transfer Higher sensitivity techniques are most likely to pick up previously deposited (background) DNA Time Adapted from Gill, P. (2002) BioTechniques 32(2): 366-385, Figure 5
Chapter 14 – Points for Discussion • Discuss advantages and disadvantages of miniSTR assays. • Name at least two ways that the presence of a mixture can be detected. • What are the causes of allele drop-in and allele drop-out in the context of amplifying low amounts of DNA template?