Download
1 / 5

E N D
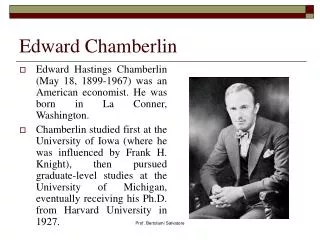
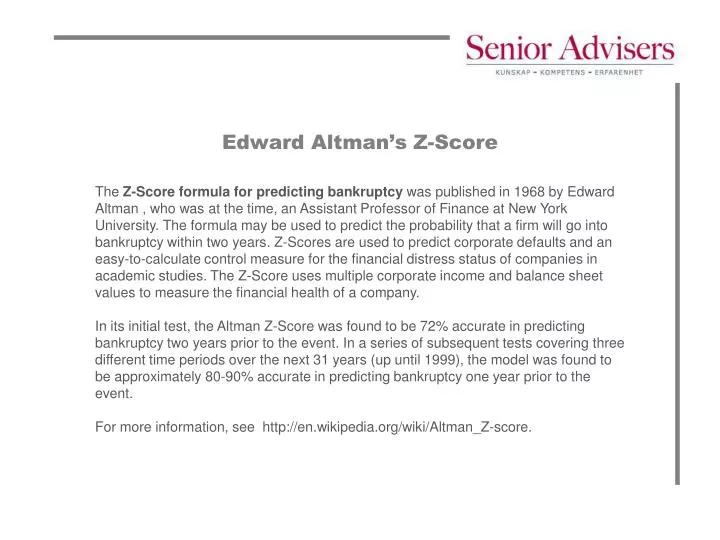
Edward Altman’s Z-Score The Z-Score formula for predicting bankruptcy was published in 1968 by Edward Altman , who was at the time, an Assistant Professor of Finance at New York University. The formula may be used to predict the probability that a firm will go into bankruptcy within two years. Z-Scores are used to predict corporate defaults and an easy-to-calculate control measure for the financial distress status of companies in academic studies. The Z-Score uses multiple corporate income and balance sheet values to measure the financial health of a company. In its initial test, the Altman Z-Score was found to be 72% accurate in predicting bankruptcy two years prior to the event. In a series of subsequent tests covering three different time periods over the next 31 years (up until 1999), the model was found to be approximately 80-90% accurate in predicting bankruptcy one year prior to the event. For more information, see http://en.wikipedia.org/wiki/Altman_Z-score.
Original Z-ScoreComponent Definitions T1 = Working Capital / Total Assets T2 = Retained Earnings / Total Assets T3 = EBIT / Total Assets T4 = Market Value of Equity / Total Liabilities T5 = Sales/ Total Assets
Z-Score estimated for Public Companies Z-ScoreBankruptcyModel Z = 1,2T1 + 1,4T2 + 3,3T3 + 0,6T4 + 0,999T5 Zones of Discrimination Z > 2.99 “Safe” Zones 1.8 < Z < 2.99 “Grey” Zones Z < 1.80 “Distress” Zones
Z-Score estimated for Private Firms Z-Score Bankruptcy Model Z = 0,717T1 + 0,847T2 + 3,107T3 + 0,420T4 + 0,998T5 Zones of Discrimination Z' > 2.9 “Safe” Zone 1.23 < Z' < 2. 9 “Grey” Zone Z' < 1.23 “Distress” Zone
Z-Score estimated for Non-Manufacturer Firms Z-ScoreBankruptcyModel Z = 6,56T1 + 3,26T2 + 6,72T3 + 1,05T4 Zones of Discrimination Z > 2.6 “Safe” Zone 1.1 < Z < 2. 6 “Grey” Zone Z < 1.1 “Distress” Zone