Download
1 / 58
580 likes | 650 Views
A Climatological Perspective of the 1962 Columbus Day Storm. Wolf Read PhD Candidate Forest Science University of British Columbia wolfread@alumni.ubc.ca. Outline. The “Classic Path”: An examination of 9 significant events from 1940-2000 Return intervals

E N D
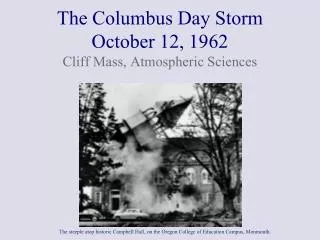
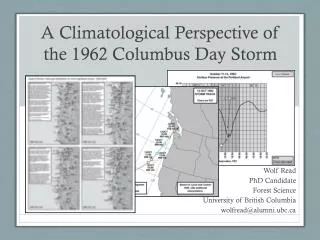
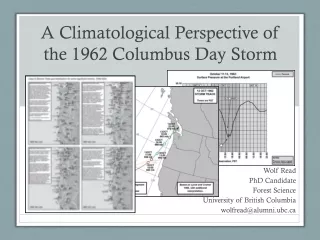
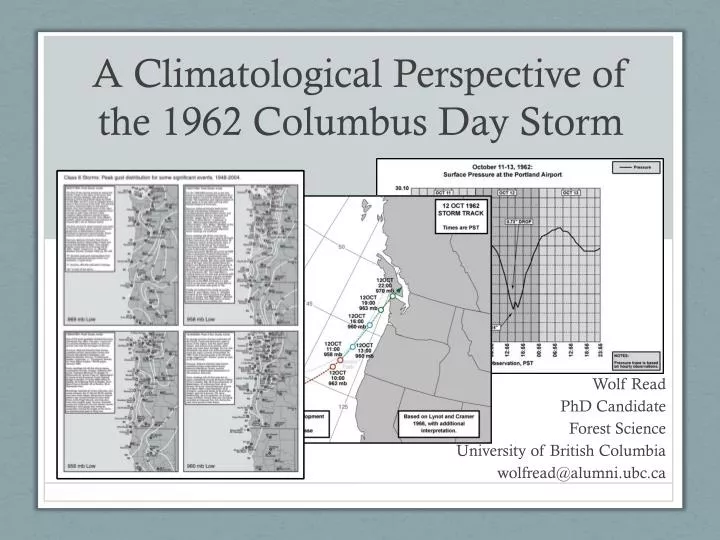
A Climatological Perspective of the 1962 Columbus Day Storm Wolf Read PhD Candidate Forest Science University of British Columbia wolfread@alumni.ubc.ca
Outline • The “Classic Path”: An examination of 9 significant events from 1940-2000 • Return intervals • Columbus Day Storm (CDS) gust magnitude: Significance relative to other storms • CDS pressure tendencies: Examination of a key reason for the extraordinary wind gusts Photos courtesy of Oregon State University.
Classic Path:Storm Tracks • These are the tracks of 8 (out of 9) significant extratropical cyclones that generated high-winds in the Pacific Northwest from 1940-2000
Classic Path:Storm Tracks • These are the tracks of 8 (out of 9) significant extratropical cyclones that generated high-winds in the Pacific Northwest from 1940-2000 • The average of these tracks, with a strong northward direction just off the Pacific Coast, is sometimes called the “Classic Path”
Classic Path:Storm Tracks • The low center crosses inside of 130ºW off the coast of Southwest OR, generally between 39º to 44º N • Low then tracks NNE toward Vancouver Island, generally 10º to 20º (sometimes up to 30º) off of true N
Classic Path:Storm Tracks • The nearly due north track is probably a more important consideration for high-winds than exactly at what latitude the low center crosses the 130ºW line • The proximity of the low center to the Pacific coast is another consideration for high-wind potential
Classic Path:Historic Peak Gust Distributions • Is there a pattern to peak gust distributions among classic path storms? • Looking at the 4 strongest events 1940-2000: • 04 Dec 1945: High winds occurred inland from Southwest OR northward • Somewhat like the Columbus Day Storm distribution…
Classic Path:Historic Peak Gust Distributions • 12 Oct 1962: The Columbus Day Storm • Extreme gust speeds carried inland • Gust speeds more typical of coastal headlands reach the interior
Classic Path:Historic Peak Gust Distributions • 13-14 Nov 1981: Pattern quite similar to the Columbus Day Storm • Exception: Strait of Juan de Fuca, where strong gusts occurred in locations that are typically spared (e.g. Port Angeles) • Wind magnitude not as strong as CDS, save for a few stations (e.g. North Bend, OR, and Sea-Tac, WA)
Classic Path:Historic Peak Gust Distributions • 11-12 Dec 1995: Like 1981, pattern again reminiscent of the Columbus Day Storm • Wind magnitude not as strong, save for a few stations (e.g. Red Bluff and San Francisco, CA)
Classic Path:Average Peak Gust Distribution • Average peak gust of 9 significant classic-path storms • Caveats: • Only 9 samples, and most stations have missing data • Therefore statistical uncertainty is high • Much variance in spatial distribution (e.g. 26 Oct 1950) • Take this analysis with a grain of salt
Classic Path:Average Peak Gust Distribution • Average peak gust of 9 significant classic-path storms • Strengths: • The strongest storms (1945, 1962, 1981 and 1995) have similar spatial patterns of gust-speed magnitude • This map is largely a reflection of the biggest storms
Classic Path:Average Peak Gust Distribution • The OR coast tends to receive the strongest gusts (>70 mph) • The northern Willamette Valley of OR and Northwest Interior of WA also appear more prone to damaging gusts (>60 mph) • High-wind gusts also tend to occur in the Puget Lowlands, but not quite with the intensity of locations S and N (55-60 mph)
Classic Path:Return Intervals • There are a number of ways to compute return intervals • Most methods utilize the wind speed record at a particular location
Classic Path:Return Intervals • There are a number of ways to compute return intervals • Most methods utilize the wind speed record at a particular location • The chart above is for Vancouver International Airport, BC
Classic Path:Return Intervals • There are a number of ways to compute return intervals • Most methods utilize the wind speed record at a particular location • The chart above is for Vancouver International Airport, BC • Analyses such as this can be made for any location with a long-term wind record
Classic Path:Return Intervals • There are a number of ways to compute return intervals • Most methods utilize the wind speed record at a particular location • For interior stations such as Portland and Seattle, the results would be similar
Classic Path:Return Intervals • There are a number of ways to compute return intervals • Most methods utilize the wind speed record at a particular location • 2-minute average wind speed is on this axis
Classic Path:Return Intervals • There are a number of ways to compute return intervals • Most methods utilize the wind speed record at a particular location • The return interval, in years, for a particular speed is on this axis
Classic Path:Return Intervals • There are a number of ways to compute return intervals • Most methods utilize the wind speed record at a particular location • The return interval, in years, for a particular speed is on this axis • The prediction beyond 44 knots is a form of induction and therefore imperfect
Classic Path:Return Intervals • A 45-knot (52 mph) wind can be expected about once a decade
Classic Path:Return Intervals • A 45-knot (52 mph) wind can be expected about once a decade • Gusts would be around (45 * 1.3) 60 knots (~70 mph)
Classic Path:Return Intervals • A 50-knot (58 mph) wind can be expected about once every 40 years • 50 knots is what occurred at CYVR during the Columbus Day Storm
Classic Path:Return Intervals • Another way of exploring return frequency: • 9 significant classic events from 1940-2000, or 61 years • Results in 1 significant classic event about every 7 years
Classic Path:Return Intervals • Another way of exploring return frequency: • 9 significant classic events from 1940-2000, or 61 years • Results in 1 significant classic event about every 7 years • 4 of these events were particularly strong: 1945, 1962, 1981 and 1995 • Results in 1 strong event every 15 years
Classic Path:Return Intervals • Another way of exploring return frequency: • 9 significant classic events from 1940-2000, or 61 years • Results in 1 significant classic event about every 7 years • 4 of these events were particularly strong: 1945, 1962, 1981 and 1995 • Results in 1 strong event every 15 years • 2012 - 1995 = 17 years
Classic Path:Return Intervals • Another way of exploring return frequency: • 1 event produced widespread 80-110 mph gusts in the interior of OR and WA (the CDS) • Return interval could be interpreted—on very limited data—as being greater than 50 years • Remember the Vancouver, BC, data that suggested a 40 year return interval for CDS-magnitude winds
Significance of the Columbus Day Storm Peak Gust Magnitude • Chart on the right compares the peak gusts from 5 of the 9 classic events from 1940-2000
Significance of the Columbus Day Storm Peak Gust Magnitude • Chart on the right compares the peak gusts from 5 of the 9 classic events from 1940-2000 • Peak gust speed in mph
Significance of the Columbus Day Storm Peak Gust Magnitude • Chart on the right compares the peak gusts from 5 of the 9 classic events from 1940-2000 • Peak gust speed in mph • Coastal stations from S to N going left to right
Significance of the Columbus Day Storm Peak Gust Magnitude • Chart on the right compares the peak gusts from 5 of the 9 classic events from 1940-2000 • Peak gust speed in mph • Coastal stations from S to N going left to right • Interior stations from S to N going left to right
Significance of the Columbus Day Storm Peak Gust Magnitude • Chart on the right compares the peak gusts from 5 of the 9 classic events from 1940-2000 • Peak gust speed in mph • Coastal stations from S to N going left to right • Interior stations from S to N going left to right • Red line is the CDS
Significance of the Columbus Day Storm Peak Gust Magnitude • The CDS is the only storm event to generate high-wind criteria gusts (50 knots, or 58 mph) at every one of these stations • 14 Nov 1981 came close!
Significance of the Columbus Day Storm Peak Gust Magnitude • Relative to the other storms, CDS coastal wind speeds were quite strong in areas, but not strikingly so, at long-term official stations • Nov 1981 and Dec 1995 produced faster speeds at North Bend, OR
Significance of the Columbus Day Storm Peak Gust Magnitude • Interior wind speeds for the CDS, however, were nearly off-scale relative to the other storms • As noted earlier, CDS interior wind speeds matched and exceeded coastal wind speeds measured during Nov 1981 and Dec 1995, marking a truly unusual situation
Significance of the Columbus Day Storm Peak Gust Magnitude • Graph on left shows an average of the peak gusts from the same 11 stations used in the previous analysis • Incorporates all windstorm events—regardless of track type—that produced a ≥40-knot (46 mph) average peak gust from 1948-2003
Significance of the Columbus Day Storm Peak Gust Magnitude • Can you find the Columbus Day Storm?
Significance of the Columbus Day Storm Peak Gust Magnitude • Can you find the Columbus Day Storm? • Are there any events that are even close to the CDS in average peak gust magnitude?
Significance of the Columbus Day Storm Peak Gust Magnitude • Can you find the Columbus Day Storm? • Are there any events that are even close to the CDS in average peak gust magnitude? • Most of the these storms have an average peak gust below 60 mph
Significance of the Columbus Day Storm Peak Gust Magnitude • Can you find the Columbus Day Storm? • Are there any events that are even close to the CDS in average peak gust magnitude? • Most of the these storms have an average peak gust below 60 mph • The CDS produced about 2-times the wind-force of the more typical events
Significance of the Columbus Day Storm Peak Gust Magnitude • One more way of looking at this: Peak gust response for 21 of the most significant windstorms in the Willamette Valley
Significance of the Columbus Day Storm Peak Gust Magnitude • During the Columbus Day Storm, Eugene reported a peak gust of 86 mph, the lowest for any official station in the Valley
Significance of the Columbus Day Storm Peak Gust Magnitude • The 86 mph low is higher than the highest Willamette Valley gust from any other windstorm (81 mph at Eugene 07 Jan 1961)
Pressure Tendencies: An Explanation for the Extraordinary CDS Winds • Pressure tendency is (in part) the rate at which the pressure changes over a fixed unit of time
Pressure Tendencies: An Explanation for the Extraordinary CDS Winds • Pressure tendency is (in part) the rate at which the pressure changes over a fixed unit of time • Fast pressure drops
Pressure Tendencies: An Explanation for the Extraordinary CDS Winds • Pressure tendency is (in part) the rate at which the pressure changes over a fixed unit of time • Slow pressure drops
Pressure Tendencies: An Explanation for the Extraordinary CDS Winds • Pressure tendency is (in part) the rate at which the pressure changes over a fixed unit of time • Fast pressure rises
Pressure Tendencies: An Explanation for the Extraordinary CDS Winds • The chart to the right depicts an 11-station average of maximum 1-hour pressure change for the 9 classic-path storms 1940-2000 • 1 hPa = 1 mb
Pressure Tendencies: An Explanation for the Extraordinary CDS Winds • The bars indicate the average of the maximum hourly pressure changes at 11 key stations
Pressure Tendencies: An Explanation for the Extraordinary CDS Winds • Pressure tendencies integrate at least three variables: • 1) Pressure gradient: If two storms are moving at the same speed, the one with the stronger gradient is likely to produce faster pressure changes as a fixed point • Higher pressure gradients tend to result in higher wind speeds L L A A B B Stronger Gradient (>Wind) Weaker Gradient (<Wind) Locations A & B are fixed points (e.g. weather stations)