Download
1 / 21
210 likes | 214 Views
Assimilation of GOES-R Atmospheric Motion Vectors in the NCEP Global Forecast System. Sharon Nebuda 1 , Jim Jung 1,2 , Dave Santek 1 , Jaime Daniels 3 , Wayne Bresky 4

E N D
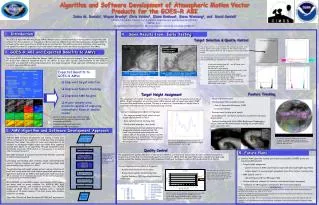
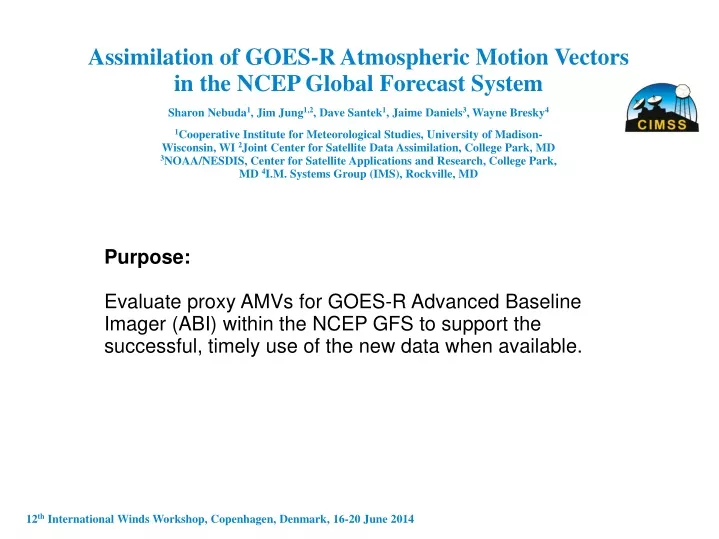
Assimilation of GOES-R Atmospheric Motion Vectors in the NCEP Global Forecast System Sharon Nebuda1, Jim Jung1,2, Dave Santek1, Jaime Daniels3, Wayne Bresky4 1Cooperative Institute for Meteorological Studies, University of Madison-Wisconsin, WI 2Joint Center for Satellite Data Assimilation, College Park, MD 3NOAA/NESDIS, Center for Satellite Applications and Research, College Park, MD 4I.M. Systems Group (IMS), Rockville, MD Purpose: Evaluate proxy AMVs for GOES-R Advanced Baseline Imager (ABI) within the NCEP GFS to support the successful, timely use of the new data when available. 12th International Winds Workshop, Copenhagen, Denmark, 16-20 June 2014
June 2012 AMV total number in a 1ºx1º grid box • Proxy GOES-R AMV Data Uses • Meteosat-9 & 10 SEVIRI imagery • GOES-R ABI Nested Tracking Algorithm • GOES-R ABI Cloud Height Algorithm 4 AMV types represent ABI Channels: • 2 visible (VIS) • 7 infrared (NIR) • 8 cloud top water vapor (CTWV) – Tb height assignment • 14 infrared (IR) Proxy data is created on an hourly frequency. Results are shown using the 6 hour synoptic frequency data. Future work is examining best use of hourly GOES-R data in the GFS. How to best assimilate this data? Need to consider: Quality Control Observation Error Departure Check Departure Statistics Impact on GFS Forecast Skill
Quality Control QI - Quality Indicator without the forecast component Used QIFN > 80 June 2012 – All data RMSE of the Vector Difference Mean Normalized Speed departure
Quality Control NEE – Normalized Expected Error Used NEE < 0.9 June 2012 – All data Mean Normalized Speed departure RMSE of the Vector Difference
Quality Control PCT1 – Cluster standard deviation / distance traveled Used 0.04< PCT1 <0.5 June 2012 – IR data Speed departure Obs – GFS Background (m/s) Black lines mark mean and standard deviation for each pct1 bin along the x axis
Quality Control PERR – Cluster median of the measure of uncertainty in cloud top height (hPa) Did not use this parameter. June 2012 – IR data Water Scenes Cirrus Scenes Opaque Cirrus Scenes Ice Overlap Scenes
Observation Error Analysis response to varying the GOES-R AMV observation error through a range of multipliers to the current GOES AMV error settings. Fit to obs (GFS Analysis – AMV) Speed Bias (left) Vector Difference RMSE (right) Blue – Original GOES Error Green – 75% GOES Error Error/10 Error*10 Original Error
Log Normal Vector Departure Check SQRT[ (UAMV – UGFS)^2 + (VAMV – VGFS)^2 ] / LOG(SpeedAMV) < 3 Top row: after QC before departure check Bottom row: after QC and departure check
Data Count – June 2012 Percent removed due to QC, Departure Check, and GSI checks.
Data Count and Fit to Obs as a function of Pressure for 3 regions Fit to obs (GFS – AMV) Speed Bias (left) Vector Difference RMSE (right) June 2012
Data Count and Fit to Obs IR AMVs as a function of Pressure for 3 regions divided into dominant cloud type in target box
Speed departure as a function of Zenith Angle 20S-25N June 2012 AMV speed – GFS Background speed
Data Count and Fit to Obs 30S-30N Ocean AMVs June 2012. Blue – no inversion, Green – with inversion GFS Background - AMV
1x1 deg grid box average from 100-700hPa for June 2012 GFS Speed (m/s) AMV-GFS Speed/ AMV Speed CTWV IR
1x1 deg grid box average from 100-700hPa for June 2012 GFS U Comp (m/s) AMV-GFS U Comp (m/s) CTWV IR
1x1 deg grid box average from 100-700hPa for June 2012 GFS V Comp (m/s) AMV-GFS V Comp (m/s) CTWV IR
Forecast Skill Impact 500 hPa Height Anomaly Correlation Coefficient Die-off curves NH Global SH 24 May – 23 July, 2014 AMVE6 – GFS simulation using GOES-R AMVs AMVC1 – GFS simulation using no AMVs from SEVIRI
Forecast Skill Impact Tropical Wind RMSE 200 hPa 850 hPa
Forecast Skill Impact Global Wind Pattern Correlation 200 hPa 850 hPa
Radiosonde Fit to Obs Solid – AMVC1 no SEVIRI AMVs Dots – AMVE6 GOES-R AMVs 0Z 12Z
Summary Selected Quality Control Settings QIFN < 80 EE/Ob Speed < 0.9 0.04 < PCT1 < 0.5 Reduced Observation Error for synoptic frequency data by 25% Applied Log Normal Vector Departure Check Forecast Skill Impact is neutral to slightly positive in the Southern Hemisphere. Next: Examine impact of hourly GOES-R AMV data with consideration given to observation error settings and use of off synoptic time data.