Download
1 / 12
120 likes | 225 Views
EILS Third Baseline Analysis. DSWG Meeting March 27, 2009. Overview. Background Information Analysis Methodology Baseline Ranking Summary Statistics Conclusions. Background Information. Proposed baseline concepts analyzed but not adopted

E N D
EILS Third Baseline Analysis DSWG Meeting March 27, 2009
Overview • Background Information • Analysis Methodology • Baseline Ranking Summary Statistics • Conclusions
Background Information • Proposed baseline concepts analyzed but not adopted • Baseline kW = average Load for the hour before notification • High X of Y (3 of 10) • Average of last X (1, 5, 10) days of same day-type • Average of last X (7, 10) days of same day-type, excluding highest and lowest days
Background Information (continued) • Day of Adjustment concepts analyzed but not adopted • Adjustment Type • Additive • Adjustment amount = (actual kW – base kW) / n where n = number of adjustment intervals • Adjusted base kW = adjustment amount + base kW • kWh values determined over selected adjustment intervals • Adjustment Intervals • Two Before • Eight intervals beginning two hours before the event start time • No time gap between adjustment intervals and event • Four Before • Eight intervals beginning four hours before the event start time • Two hour time gap between adjustment intervals and event
Background Information (continued) • EILS sub-team identified two additional baseline methodologies to support a “drop-by” curtailment • Mid 8 of 10 (Olympic) with Day of Adjustment • Matching Day Pair with Day of Adjustment • Ercot analysis goal was to identify which of the two additional baselines should be offered.
Regression Model(default) • Model development continues unchanged from beginning of EILS • Added baseline day-of adjustment: • Scalar • Adjustment factor = actual kWh / base kWh • Adjusted base kW = adjustment factor × base kW • kWh values determined over selected adjustment intervals • Three Before • Eight intervals beginning three hours before the event start time • One hour time gap between adjustment intervals and event
Mid 8 of 10(Olympic) • Find 10 most recent days with the same day-type as the event day • Compute kWh for each of the 10 days • Eliminate the days with the highest and lowest kWh • Day Types • Weekday • Weekend/Holiday • Baseline is the average of the 8 days together by interval • Baseline day-of adjustment: • Scalar • Adjustment factor = actual kWh / base kWh • Adjusted base kW = adjustment factor × base kW • kWh values determined over selected adjustment intervals • Three Before • Eight intervals beginning three hours before the event start time • One hour time gap between adjustment intervals and event
Matching Day Pair Baseline(Déjà VuMethod) • Find 10 closest matching day-pairs -- match intervals for the entire day before and the day of the event up to 1 hour before start of event • Match By Day Pair Types (based on event day) • Weekday • Weekend/Holiday • Baseline is the average of the 10 day-pairs together by interval • Baseline day-of adjustment: • Scalar • Adjustment factor = actual kWh / base kWh • Adjusted base kW = adjustment factor × base kW • kWh values determined over selected adjustment intervals • Three Before • Eight intervals beginning three hours before the event start time • One hour time gap between adjustment intervals and event
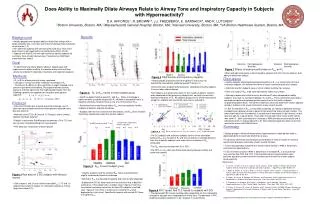
Analysis Methodology Identified two groups of ESIIDs selected from previous contract cycles • Alternate Baseline ESIIDs • Eliminated very large “Batch Processing” Loads • 137 ESIIDs used in the analysis • Default Baseline ESIIDs • 67 ESIIDs used in the analysis • Extracted interval data for January 1, 2006 thru February 13, 2009 • Simulated 2 hour EILS events for every possible baseline hour for each ESIID • Determined unadjusted baseline kW for the 3 “drop-by” baselines • Applied day-of adjustment factor to create an adjusted baseline kW • Calculated the difference between actual and baseline Load for all intervals in the event • Computed summary statistics to compare the baselines at the ESIID level • R-Square • Mean absolute percent difference • Mean percent difference • 95th percentile overprovision (kW) • 95th percentile overprovision as a percent of mean kW • Established thresholds for drop-by baseline consideration: • Mean percent difference (absolute value < 5%) - Unbiased • 95th percentile overprovision as a percent of mean kW (<20%) • Ranked baselines for each percentage statistic and determined the best baseline(s) for each ESIID based on overall accuracy
Baseline Ranking Summary Statistics D = Default M = Matching Day Pair O = Mid 8 of 10 • Table above shows counts of ESIIDs meeting the threshold requirements and with enough data to determine all 3 “drop-by” baselines • For many ESIIDs baseline assignments tend to be Contract Period Specific • An ESIID could be “M” in OctJan and “O” in FebMay • Many ESIIDs currently on “D” would have the option any of the 3 drop-by baselines • About one-half of ESIIDs previously assigned to the Alternate baseline could now be assigned to a drop-by baseline • About one-fourth of ESIIDs previously assigned to the Alternate baseline would have the option any of the 3 drop-by baselines
Baseline Ranking Summary Statistics D = Default M = Matching Day Pair O = Mid 8 of 10 • Tables above are counts of ESIIDs meeting the threshold requirements and with enough data to determine all 3 “drop-by” baselines • Baseline assignments are Time Period as well as Contract Period Specific • ESIID baseline assignment for a Contract Period would be dependent on which Time Periods are being offered • If an ESIID bids into less then the 4 Time Periods a drop-by assignment becomes more likely
Conclusions • “Matching Day Pair” and “Mid 8 of 10” baselines should be made available for EILS • More ESIIDs would have the option of a drop-by baseline • Baseline shadowing is more manageable • Many ESIIDs could be offered more than one drop-by baseline option • ERCOT will provide comparative statistics to assist QSE with the baseline selection • If no “Drop-by” baseline performs adequately then “Alternate” baseline would be assigned • QSE could opt for “Alternate” baseline • Overprovision levels have to be carefully considered for any drop-by baseline by each QSE • ERCOT will provide 95th percentile overprovision levels to facilitate QSE decision • Performance and availability for an aggregation can be computed even with a mix of drop-by baselines assignments • For initial roll-out, the sub-team has recommended assigning the same baseline to all ESIIDs in an aggregation • Drop-by baseline assignments can be contingent on the specific set of Time Periods being offered • ERCOT’s baseline assignment could change between Resource Identification and Bid Submission if the Time Periods are modified • ERCOT’s baseline review service needs to modified to consider all 3 drop-by baselines • The service may not be available prior to the next bidding cycle • ERCOT is continuing to analyze the performance of the baseline algorithms