Download
1 / 14
140 likes | 231 Views
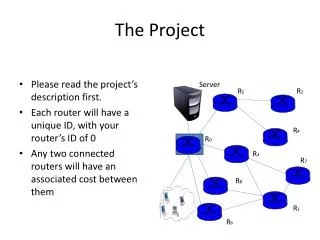
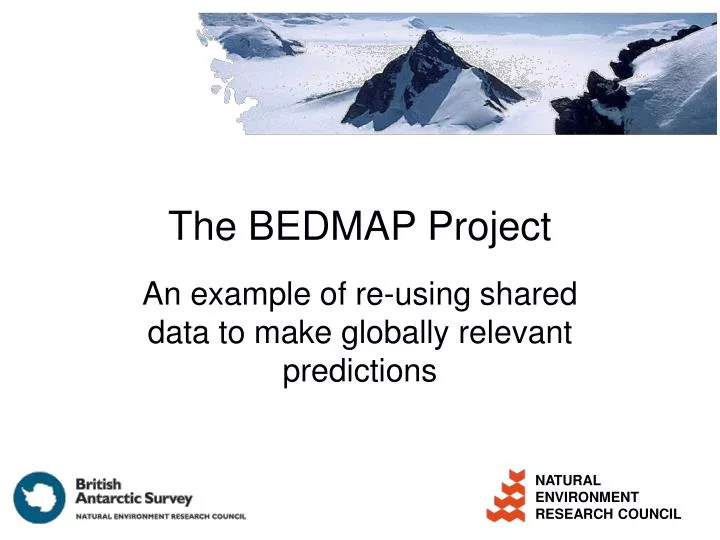
The BEDMAP Project. An example of re-using shared data to make globally relevant predictions. Antarctica. The questions addressed. The process undertaken. The products. Why the project succeeded. And thus what lessons can be learnt. Antarctica.

E N D
The BEDMAP Project An example of re-using shared data to make globally relevant predictions
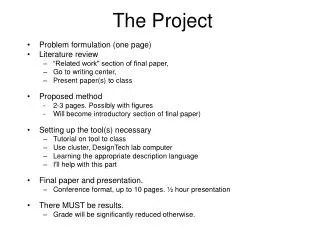
Antarctica. • The questions addressed. • The process undertaken. • The products. • Why the project succeeded. • And thus what lessons can be learnt.
Antarctica • 13M km2. Over 58 times the size of the UK, the highest, coldest and windiest continent. • Icecap contains almost 70% of the world's freshwater and 90% of the world's ice. • British Antarctic Survey. A wholly owned NERC Research Centre. • Undertakes the majority of Britain's scientific research on and around the Antarctic continent.
Questions • What is the shape of the land beneath the ice sheet? • How much ice is there in the ice sheet? • And thus its potential contribution to sea level rise.
Process • BEDMAP consortium: 12 countries under the auspices of SCAR. • Protocol: data remain under ‘control’ of contributors so some access restrictions. • Production of database of ice thickness measurements. • 2.5M direct measurements; • Estimate 90% of all data existing (2000); • 10% not included: old data now lost & recent surveys not released by PIs.
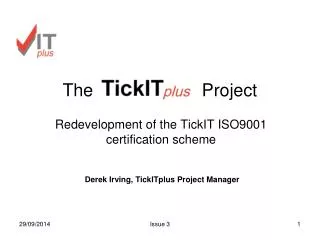
Product • Ice thickness model(5km grid)
Product • Sub-ice topography
Product • Sub-ice topography
Product • Coordinated database and gridded data sets
Product • New estimate for volume of Antarctic ice sheet: 25.4 x 10⁶ km3. • Close to early estimates, but 15% less than widely quoted 30.1 x 10⁶ km3 from 1983. • New estimate for amount of sea level equivalent of the ice volume: 57m. • Lower than other estimates: 73m (1986) and 61m (2000).
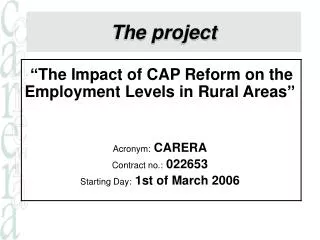
Success • Antarctic Treaty, Article III-1-c. • scientific observations and results from Antarctica shall be exchanged and made freely available. • Antarctic science is international – expectation of cooperation. • A project of the scientific community.
Success • Data were known: information available on what data exists and the specifics of the data. • Metadata not always formally documented, PIs had their own detailed knowledge. • Funds available to do the work. • Defined goal to the project. • Good staff: Understood the science and the data issues.
Further information • NERC: www.nerc.ac.uk • BAS: www.antarctica.ac.uk • BEDMAP: www.antarctica.ac.uk/aedc/bedmap • SCAR: www.scar.org • Reference: Lythe, M.B. & Vaughan, D.G. BEDMAP: A new ice thickness and subglacial topographic model of Antarctica. J. Geophys. Res., 106 B6, 11,335 – 11,351, 2001.