Download

1 / 23
230 likes | 363 Views
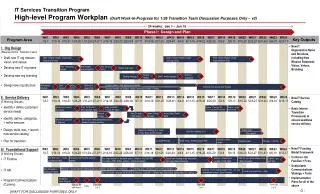
Thu Jun 1 2006. Google Analytics for activeinterface.com Marketing Optimization. Unique Visitor Tracking Daily Visitors. Visitors Graph. Percent New Visitors. Unique Visitor Tracking Visits & Pageview Tracking. Visits. Pageviews. Unique Visitor Tracking Goal Conversion Tracking.

E N D
Thu Jun 1 2006 Google Analytics for activeinterface.com Marketing Optimization
Unique Visitor Tracking Daily Visitors Visitors Graph Percent New Visitors
Unique Visitor Tracking Visits & Pageview Tracking Visits Pageviews
Unique Visitor Tracking Goal Conversion Tracking
Unique Visitor Tracking Absolute Unique Visitors
Unique Visitor Tracking Visitor Loyalty
Unique Visitor Tracking Visitor Recency
Visitor Segment Performance New vs Returning
Visitor Segment Performance Referring Source
Visitor Segment Performance Geo Location
Visitor Segment Performance Geo Map Overlay Country/Region/City Visits P/Visit G1/Visit $/Visits United Kingdom-London 14 3.71 0.00 0.00 Singapore-Singapore 8 3.13 0.00 0.00 Brazil-São Paulo 8 3.00 0.00 0.00 India-Bangalore 7 1.71 0.00 0.00 Canada-Vancouver 7 1.71 0.00 0.00 South Africa-Roggebaai 7 2.71 0.00 0.00 Canada-Ottawa 6 2.50 0.00 0.00 Spain-Badalona 6 13.33 0.00 0.00 Paraguay-Asunción 6 1.00 0.00 0.00 United States-New York 6 3.33 0.00 0.00 other [N=366] 522 1037.17 0 0
Visitor Segment Performance Network Location Organization Name Visits P/Visit G1/Visit $/Visits Comcast Cable 22 1.59 0.00 0.00 (not set) 17 2.06 0.00 0.00 SBC Internet Services 11 1.64 0.00 0.00 Telefonica de Espana 9 9.44 0.00 0.00 British Telecommunications 9 1.56 0.00 0.00 Videsh Sanchar Nigam Ltd - India. 8 2.13 0.00 0.00 Government of South Africa 7 2.71 0.00 0.00 Cox Communications 7 2.14 0.00 0.00 Núcleo S.A. 6 1.00 0.00 0.00 Warshaw Jacobson Group 6 3.33 0.00 0.00 other [N=388] 531 1095.26 0 0
Visitor Segment Performance Language Language Visits P/Visit G1/Visit $/Visits en-us (English United States) 493 3.25 0.00 0.00 zh-cn (Chinese PRC) 16 3.00 0.00 0.00 pt-br (Portuguese Brazil) 14 2.21 0.00 0.00 en (English) 12 2.17 0.00 0.00 de (German Standard) 11 1.91 0.00 0.00 es (Spanish Spain Traditional) 10 1.40 0.00 0.00 it (Italian Standard) 9 4.67 0.00 0.00 es-la 8 1.25 0.00 0.00 en-gb (English United Kingdom) 8 2.50 0.00 0.00 pl (Polish) 8 3.00 0.00 0.00 other [N=18] 44 69.5 0 0
Visitor Segment Performance Domains
Marketing Campaign Results Campaign Conversion
Marketing Campaign Results Source Conversion
Marketing Campaign Results Medium Conversion
Marketing Campaign Results Referral Conversion
Marketing Campaign Results Campaign ROI
Marketing Campaign Results Source ROI
Marketing Campaign Results Medium ROI
Search Engine Marketing CPC Program Analysis
Search Engine Marketing Overall Keyword Conversion