Download
1 / 2
40 likes | 201 Views
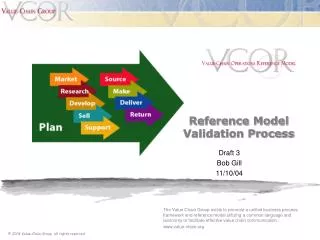
Curve Validation Process. CRG & GRMO. Commodity Risk Groups (CRG). CRG & Trader. GRMO. Curve Selection. Curve Data Gathering. Curve Comparisons. Delta Analysis. Explanation & Reporting. Evaluation & Summary. P&L or Position. CRG validation report. Review CRG reports.

E N D
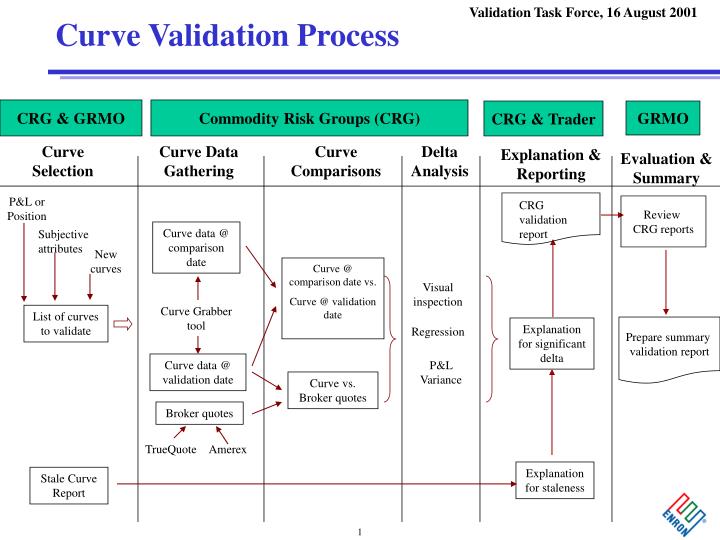
Curve Validation Process CRG & GRMO Commodity Risk Groups (CRG) CRG & Trader GRMO Curve Selection Curve Data Gathering Curve Comparisons Delta Analysis Explanation & Reporting Evaluation & Summary P&L or Position CRG validation report Review CRG reports Curve data @ comparison date Subjective attributes New curves Curve @ comparison date vs. Curve @ validation date Visual inspection Curve Grabber tool List of curves to validate Prepare summary validation report Explanation for significant delta Regression Curve data @ validation date P&L Variance Curve vs. Broker quotes Broker quotes TrueQuote Amerex Explanation for staleness Stale Curve Report
Curve Selection Functionalities • Stale curve report (initiating development) • Listing of curves unchanged for X number of days • Option to specify which part of the curve to examine • Historical band (initiating development) • Shows max and min historical boundaries • P&L sensitivity (initiating development) • ranking of curves based on P&L contribution to a portfolio • Option to look at full term, or by reference date • Position sensitivity (initiating development) • Same as P&L sensitivity above but using positions (benchmark, delta, gamma, gross) • Curve mappings (in testing) • Listing of curves associated with a portfolio/book • Also shows whether the curve is a primary or a secondary curve (and which primary curve it is mapped to) • By trader (next phase) • Implementable on current tools but will have to structure portfolios by trader • “Big” shifts (next phase) • Visual inspection for now