Download
1 / 1
10 likes | 138 Views
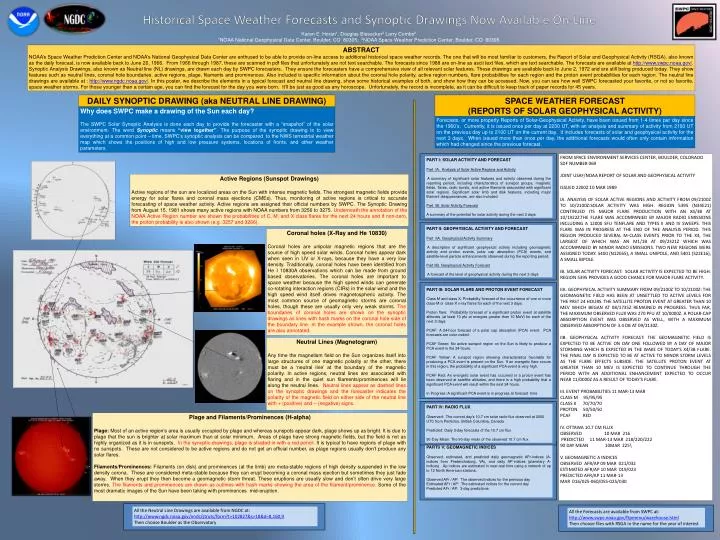
Historical Space Weather Forecasts and Synoptic Drawings Now Available On-Line . Karen E. Horan 1 , Douglas Biesecker 2 Larry Combs 2 1 NOAA National Geophysical Data Center, Boulder, CO 80305; 2 NOAA Space Weather Prediction Center, Boulder, CO 80305. ABSTRACT

E N D
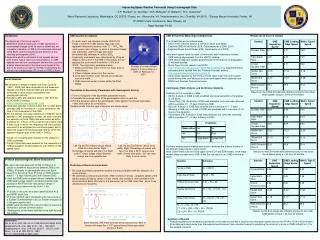
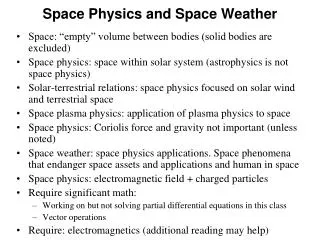
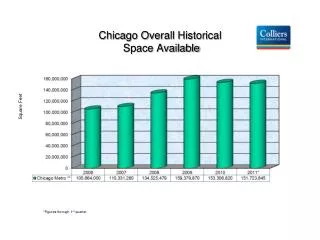
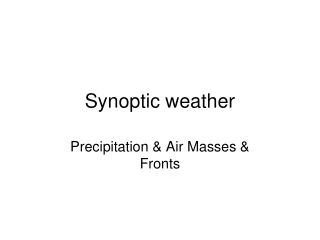
Historical Space Weather Forecasts and Synoptic Drawings Now Available On-Line Karen E. Horan1, Douglas Biesecker2 Larry Combs2 1NOAA National Geophysical Data Center, Boulder, CO 80305; 2NOAA Space Weather Prediction Center, Boulder, CO 80305 ABSTRACT NOAA’s Space Weather Prediction Center and NOAA’s National Geophysical Data Center are enthused to be able to provide on-line access to additional historical space weather records. The one that will be most familiar to customers, the Report of Solar and Geophysical Activity (RSGA), also known as the daily forecast, is now available back to June 20, 1966. From 1966 through 1987, these are scanned in pdf files that unfortunately are not text searchable. The forecasts since 1988 are on-line as ascii text files, which are text searchable. The forecasts are available at http://www.swpc.noaa.gov/. Synoptic Analysis Drawings, also known as Neutral line (NL) drawings, are drawn each day by SWPC forecasters. They ensure the forecasters have a comprehensive view of all relevant solar features. These drawings are available back to June 2, 1972 and are still being produced today. They show features such as neutral lines, coronal hole boundaries, active regions, plage, filaments and prominences. Also included is specific information about the coronal hole polarity, active region numbers, flare probabilities for each region and the proton event probabilities for each region. The neutral line drawings are available at : http://www.ngdc.noaa.gov/. In this poster, we describe the elements in a typical forecast and neutral line drawing, show some historical examples of both, and show how they can be accessed. Now, you can see how well SWPC forecasted your favorite, or not so favorite, space weather storms. For those younger than a certain age, you can find the forecast for the day you were born. It’ll be just as good as any horoscope. Unfortunately, the record is incomplete, as it can be difficult to keep track of paper records for 45 years. DAILY SYNOPTIC DRAWING (aka NEUTRAL LINE DRAWING) SPACE WEATHER FORECAST (REPORTS OF SOLAR GEOPHYSICAL ACTIVITY) Why does SWPC make a drawing of the Sun each day? The SWPC Solar Synoptic Analysis is done each day to provide the forecaster with a “snapshot” of the solar environment. The word Synopticmeans “view together”. The purpose of the synoptic drawing is to view everything at a common point – time. SWPC’s synoptic analysis can be compared to the NWS terrestrial weather map which shows the positions of high and low pressure systems, locations of fronts, and other weather parameters. • Forecasts, or more properly Reports of Solar-Geophysical Activity, have been issued from 1-4 times per day since the 1960’s. Currently, it is issued once per day at 2200 UT, with an analysis and summary of activity from 2100 UT on the previous day up to 2100 UT on the current day. It includes forecasts of solar and geophysical activity for the next 3 days. When issued more than once per day, the additional forecasts would often only contain information which had changed since the previous forecast. FROM SPACE ENVIRONMENT SERVICES CENTER, BOULDER, COLORADO SDF NUMBER 069 JOINT USAF/NOAA REPORT OF SOLAR AND GEOPHYSICAL ACTIVITY ISSUED 2200Z 10 MAR 1989 IA. ANALYSIS OF SOLAR ACTIVE REGIONS AND ACTIVITY FROM 09/2100Z TO 10/2100Z:SOLAR ACTIVITY WAS HIGH. REGION 5395 (N34E21) CONTINUED ITS MAJOR FLARE PRODUCTION WITH AN X4/3B AT 10/1922Z.THE FLARE WAS ACCOMPANIED BY MAJOR RADIO EMISSIONS INCLUDING A 12000 SFU TENFLARE AND TYPES II AND IV SWEEPS. THIS FLARE WAS IN PROGRESS AT THE END OF THE ANALYSIS PERIOD. THIS REGION PRODUCED SEVERAL M-CLASS EVENTS PRIOR TO THE X4, THE LARGEST OF WHICH WAS AN M1/1B AT 09/2321Z WHICH WAS ACCOMPANIED BY MINOR RADIO EMISSIONS. TWO NEW REGIONS WERE ASSIGNED TODAY: 5400 (N12E65), A SMALL UNIPOLE, AND 5401 (S22E16), A SMALL BIPOLE. IB. SOLAR ACTIVITY FORECAST: SOLAR ACTIVITY IS EXPECTED TO BE HIGH. REGION 5395 PROVIDES A GOOD CHANCE FOR MAJOR FLARE ACTIVITY. IIA. GEOPHYSICAL ACTIVITY SUMMARY FROM 09/2100Z TO 10/2100Z: THE GEOMAGNETIC FIELD HAS BEEN AT UNSETTLED TO ACTIVE LEVELS FOR THE PAST 24 HOURS. THE SATELLITE PROTON EVENT AT GREATER THAN 10 MEV WHICH BEGAN AT 08/1735Z REMAINED IN PROGRESS. THUS FAR, THE MAXIMUM OBSERVED FLUX WAS 270 PFU AT 10/0000Z. A POLAR-CAP ABSORPTION EVENT WAS OBSERVED AS WELL, WITH A MAXIMUM OBSERVED ABSORPTION OF 3.4 DB AT 09/2130Z. IIB. GEOPHYSICAL ACTIVITY FORECAST: THE GEOMAGNETIC FIELD IS EXPECTED TO BE ACTIVE ON DAY ONE FOLLOWED BY A DAY OF MAJOR STORMING WHICH IS EXPECTED IN THE WAKE OF TODAY'S X4/3B FLARE. THE FINAL DAY IS EXPECTED TO BE AT ACTIVE TO MINOR STORM LEVELS AS THE FLARE EFFECTS SUBSIDE. THE SATELLITE PROTON EVENT AT GREATER THAN 10 MEV IS EXPECTED TO CONTINUE THROUGH THE PERIOD WITH AN ADDITIONAL ENHANCEMENT EXPECTED TO OCCUR NEAR 11/0000Z AS A RESULT OF TODAY'S FLARE. III. EVENT PROBABILITIES 11 MAR-13 MAR CLASS M 95/95/95 CLASS X 70/70/70 PROTON 50/50/50 PCAF RED IV. OTTAWA 10.7 CM FLUX OBSERVED 10 MAR 216 PREDICTED 11 MAR-13 MAR 218/220/222 90 DAY MEAN 10MAR 225\ V. GEOMAGNETIC A INDICES OBSERVED AFR/AP 09 MAR 021/032 ESTIMATED AFR/AP 10 MAR 019/023 PREDICTED AFR/AP 11 MAR-13 MAR 016/025-060/055-025/030 PART I: SOLAR ACTIVITY AND FORECAST Part IA. Analysis of Solar Active Regions and Activity A summary of significant solar features and activity observed during the reporting period, including characteristics of sunspot groups, magnetic fields, flares, radio bursts, and active filaments associated with significant solar regions. Significant solar limb and disk features, including major filament disappearances, are also included. . Part IB. Solar Activity Forecast A summary of the potential for solar activity during the next 3 days Active Regions (Sunspot Drawings) Active regions of the sun are localized areas on the Sun with intense magnetic fields. The strongest magnetic fields provide energy for solar flares and coronal mass ejections (CMEs). Thus, monitoring of active regions is critical to accurate forecasting of space weather activity. Active regions are assigned their official numbers by SWPC. The Synoptic Drawing from August 15, 1981 shows many active regions with NOAA numbers from 3256 to 3275. Underneath the annotation of the NOAA Active Region number are shown the probabilities of C, M, and X class flares for the next 24 hours and if non-zero, the proton probability is also shown (e.g. 3257 and 3266). Coronal holes (X-Ray and He 10830) Coronal holes are unipolar magnetic regions that are the source of high speed solar winds. Coronal holes appear dark when seen in UV or X-rays, because they have a very low density. Traditionally, coronal holes have been identified from He I 10830A observations which can be made from ground based observatories. The coronal holes are important to space weather because the high speed winds can generate co-rotating interaction regions (CIRs) in the solar wind and the high speed wind itself drives magnetospheric activity. The most common source of geomagnetic storms are coronal holes, though these are usually only very weak storms. The boundaries of coronal holes are shown on the synoptic drawings as lines with hash marks on the coronal hole side of the boundary line. In the example shown, the coronal holes are also annotated. PART II: GEOPHYSICAL ACTIVITY AND FORECAST Part IIA. Geophysical Activity Summary A description of significant geophysical activity including geomagnetic activity and proton events, polar cap absorption (PCA) events, and satellite-level particle enhancements observed during the reporting period. Part IIB. Geophysical Activity Forecast A forecast of the level of geophysical activity during the next 3 days PART III: SOLAR FLARE AND PROTON EVENT FORECAST Class M and class X: Probability forecast of the occurrence of one or more class-M or class-X x-ray flares for each of the next 3 days. Proton flare: Probability forecast of a significant proton event at satellite altitudes (at least 10 pfu at energies greater than 10 MeV) for each of the next 3 days PCAF: A 24-hour forecast of a polar cap absorption (PCA) event. PCA forecasts are color coded: PCAF Green: No active sunspot region on the Sun is likely to produce a PCA event in the 24 hours. PCAF Yellow: A sunspot region showing characteristics favorable for producing a PCA event is present on the Sun. If an energetic flare occurs in this region, the probability of a significant PCA event is very high. PCAF Red: An energetic solar event has occurred or a proton event has been observed at satellite altitudes, and there is a high probability that a significant PCA event will result within the next 24 hours. In Progress: A significant PCA event is in progress at forecast time Neutral Lines (Magnetogram) Any time the magnetism field on the Sun organizes itself into large structures of one magnetic polarity or the other, there must be a ‘neutral line’ at the boundary of the magnetic polarity. In active regions, neutral lines are associated with flaring and in the quiet sun filaments/prominences will lie along the neutral lines. Neutral lines appear as dashed lines on the synoptic drawings and the forecaster indicates the polarity of the magnetic field on either side of the neutral line with + (positive) and – (negative) signs. Plage and Filaments/Prominences (H-alpha) Plage: Most of an active region’s area is usually occupied by plage and whereas sunspots appear dark, plage shows up as bright. It is due to plage that the sun is brighter at solar maximum than at solar minimum. Areas of plage have strong magnetic fields, but the field is not as highly organized as it is in sunspots. In the synoptic drawings, plage is shaded in with a red pencil. It is typical to have regions of plage with no sunspots. These are not considered to be active regions and do not get an official number, as plage regions usually don’t produce any solar flares. Filaments/Prominences: Filaments (on disk) and prominences (at the limb) are meta-stable regions of high density suspended in the low density corona. These are considered meta-stable because they can erupt becoming a coronal mass ejection but sometimes they just fade away. When they erupt they then become a geomagnetic storm threat. These eruptions are usually slow and don’t often drive very large storms. The filaments and prominences are drawn as outlines with hash marks showing the area of the filament/prominence. Some of the most dramatic images of the Sun have been taking with prominences mid-eruption. PART IV: RADIO FLUX Observed: The current day's 10.7 cm solar radio flux observed at 2000 UTC from Penticton, British Columbia, Canada Predicted: Daily 3-day forecasts of the 10.7 cm flux 90-Day Mean: The 90-day mean of the observed 10.7 cm flux PARTS V: GEOMAGNETIC INDICES Observed, estimated, and predicted daily geomagnetic AFr-indices (A-indices from Fredericksburg, VA), and daily AP-indices (planetary A-indices). Ap indices are estimated in near-real time using a network of up to 12 North American stations. Observed AFr / AP: The observed indices for the previous day Estimated AFr / AP: The estimated indices for the current day Predicted AFr / AP: 3-day predictions All the Neutral Line Drawings are available from NGDC at: http://www.ngdc.noaa.gov/nndc/struts/form?t=102827&s=18&d=8,160,9 Then choose Boulder as the Observatory All the Forecasts are available from SWPC at: http://www.swpc.noaa.gov/ftpmenu/warehouse.html Then choose files with RSGA in the name for the year of interest