Download
1 / 15
150 likes | 234 Views
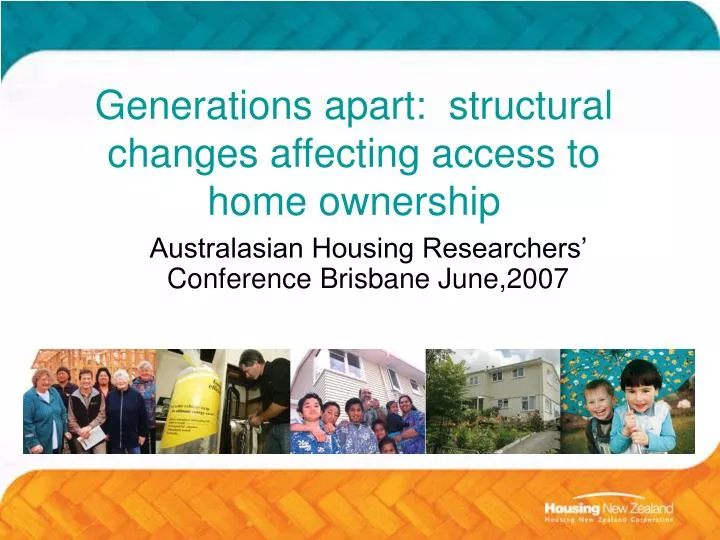
Generations apart: structural changes affecting access to home ownership. Australasian Housing Researchers’ Conference Brisbane June,2007. Home ownership trends. 1991- 2006: est. 8% decline in 15 years 74.9% > 66.9% (adjusted for ‘family trusts’) 2000’s - key features

E N D
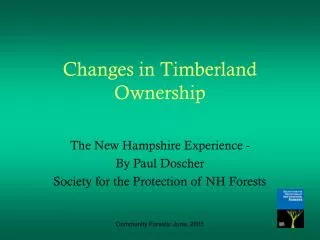
Generations apart: structural changes affecting access to home ownership Australasian Housing Researchers’ Conference Brisbane June,2007
Home ownership trends 1991- 2006: est. 8% decline in 15 years 74.9% > 66.9% (adjusted for ‘family trusts’) 2000’s - key features • deteriorating affordability thru’ prolonged housing boom • house price growth exceeds mortgage rates and real wages • less pressure on rents (due to investment & AS review) • first home buyers ‘crowded out’ • political and policy spotlight on cyclical ‘drivers’ of housing inflation, incld. constraints on supply YET, supply-side remarkably responsive
Source: Massey University Real Estate Unit Housing Affordability Index
Role of underlying structural change What’s changed in a generation? 1950s-60s v. 1980s and 2000’s Weekly h’hld exp ($2003-04) 1954-55 1981-82 2003-04 Mortgage payments 12.40 41.70 81.40 Rent, rates & house repairs 49.70 99.40 135.20 Power and fuel 22.10 20.20 28.10 Private transport 80.10 113.40 107.20 Total spending 817.20 823.10 888.40 Source: Easton, B Consumption in New Zealand 1954-55 to 64-95; StatsNZ
Changes affecting demand: • household change - disparity btw 1 & 2 earnerhouseholds • immigration policy, migrant ‘waves’, composition • adjustments impacting on workforce structure - removal of tarrif protection - wages legislation - female participation rates • expanded tertiary education, loans and debt
Changes affecting ‘capacity to pay’: • liberalisation and deregulation of financial markets • overseas investment in residential property • mortgage rates relative to general inflation • bank competition for market share • ‘borrowing’ culture replaces saving • more favourable tax treatment of property - capital gains problematic; ‘family trusts’; ‘LAQCs’
Changes to housing assistance 1951-66: 8% growth in home ownership in 15 yrs • ‘universalism’ replaced by ‘selectivity’ • > 1970’s - State Advances loans and capitalisation of child endowment • > 2000’s - mortgage insurance scheme • ‘shared equity’ • Kiwisaver – access to retirement savings in 2010
Changes to housing supply • subsidized mortgage finance no longer tied to construction of new ‘entry-level’ homes • developers building larger homes for upper end • building & design standards gradually tightened • infrastructure and services more elaborate • councils operating cost recovery regime
Impact on access and affordability In the 2000’s • escalating house prices main obstable to access • mix of borrowers has changed • ‘late-comers’ have more debt • ‘baby-boomers’ (1945-64) are in peak earning yrs, are outright owners, ‘trading up’ and investing • property investors have increased market share • first-time buyers are being ‘crowded out’ • one income insufficient – rates declining for 20-30 yr-olds and Maori and Pacific households
Longer term implications • greater dependence on life time renting • less security in retirement for non-owners • greater concentration of housing wealth • potential for inter-generational transfers to amplify income inequality • could ‘over-investment’ in housing jeopardise fiscal stability?
Composition of net wealth for couples Wealth quintile Housing¹ Pension NZS Other ² Total Ages 45-54 1 24,500 1,800 314,100 -1,100 339,200 5 473,900 35,600 328,400 1,197,800 2,035,700 Ages 55-64 1 30,400 3,100 334,600 20,200 388,300 5 444,600 39,500 346,300 1,264,200 2,094,600 ¹ Net equity in own home ²Other investment property Source: Scobie et al., NZ Treasury (2007) based on SOFIE