Download
1 / 15
170 likes | 307 Views
Circling Back To Little’s Law. Now that we have tools to gather information. Latency – A measure of time delay experienced in a system, the precise definition of which depends on the system and the time being measured. In storage, latency is generally referred to as response time, in ms.

E N D
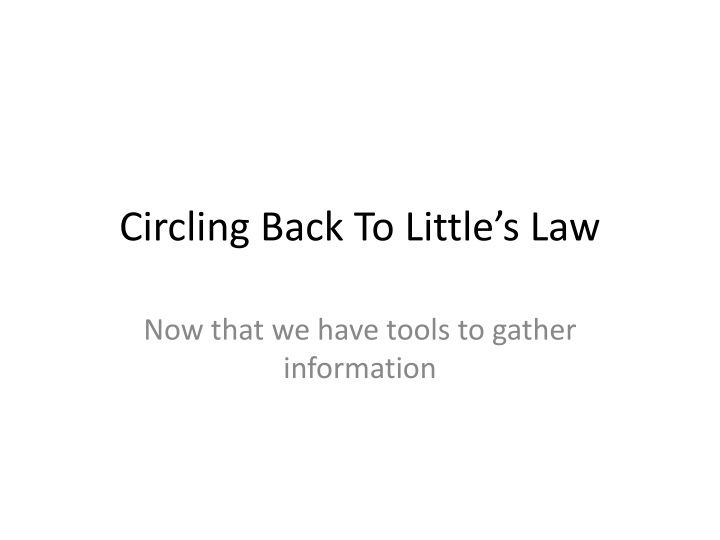
Circling Back To Little’s Law Now that we have tools to gather information
Latency – A measure of time delay experienced in a system, the precise definition of which depends on the system and the time being measured. In storage, latency is generally referred to as response time, in ms. Throughput – The amount of material or items passing through a system or process. In storage, IO/s in units of 4k
Latency & Throughput Latency starts to spike as near saturation Random SQL SERVER example: http://www.sql-server-performance.com/2003/2000io-config-sannas/
Latency & Throughput Latency starts to spike as near saturation
True in Real Life Too A LATENCY LATENCY B throughput throughput B
Little’s Law Review & Example • Little’s Law: • Restated: N = L * W N = # Cars in JamT = Lanes (Throughput)Wait = time from A->B • Assume 4 cars arrive every second (lanes) • A->B is 30 seconds • N = 4*30 = 120
Little’s Law - Review We can use this with Latency & Throughput on a Netapp system too. Standard version: Re-written for Netapp: Translating into IO terms: N = # of outstanding IOsT = Throughput of IOsR = Response time of each IO
Little’s Law - An Example • Typical situation: • An user complains of poor performance:My dd/cp/tar/Oracle query (for example: full table scan) etc. process isn’t fast enough • A casual look at sysstat shows the filer is not very busy • NetApp Service returns with a statement of “thread-limited” • What does this mean?
Compute Wait for Storage Data Return Data Return Data Return Read Request Read Request Read Request Read Request Time Little’s Law - An Example In this example, the process is either computing or reading. It is always busy. But the CPU and the storage are not, on average, fully used. Client side tools would be needed to determine this: debugger, strace, dtrace, etc.
Little’s Law - An Example • Using stats show volume: • volume:dwhprod1:san_read_data:28828868b/s volume:dwhprod1:san_read_latency:4.23ms volume:dwhprod1:san_read_ops:653/s • How many threads (on average) are running here?From Little’s Law: • (N threads) / (service time per op) = throughput
Little’s Law - An Example • How many threads (on average) are running here? • (N threads) / (service time per op) = throughput • N threads = throughput × (service time) • Service Time: • volume:dwhprod1:san_read_latency:4.23ms • Throughput: • volume:dwhprod1:san_read_ops:653/s
Little’s Law - An Example • How many threads (on average) are running here? • throughput × (service time) N threads • 653 × .00423 2.8 • What are the performance implications of having only 2.8 concurrent requests (on average)?
Little’s Law - An Example • This example is a concurrency-limited workload • Each thread is always busy • Not enough threads to keep the system busy • Implications: • Storage system not fully utilized • High I/O wait times at the server
Little’s Law - An Example Solution: • Add more threads • Sometimes you cannot, for example if there is a mapping of 1 thread to each application user, you cannot increase the user population • Fix Client Inefficiencies • FCP/iSCSI - Increase queue depth • NFS - Poor IO concurrency due to inefficient NFS client design, use an updated NFS client or 3rd party product (ex. Oracle DirectNFS) and/or • Make the IO subsystem/disks faster • Including fixing client filesystemcaching • PAM/Hybrid Aggregates