Download
1 / 19
190 likes | 196 Views
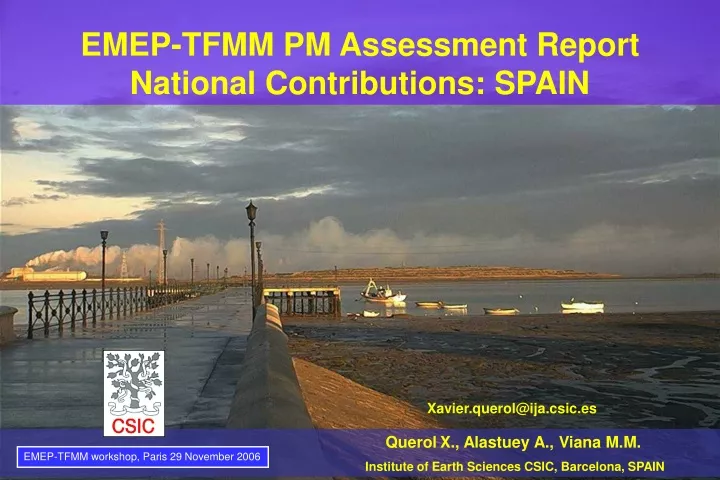
EMEP-TFMM PM Assessment Report National Contributions: SPAIN. Xavier.querol@ija.csic.es. Querol X., Alastuey A., Viana M.M.

E N D
EMEP-TFMM PM Assessment Report National Contributions: SPAIN Xavier.querol@ija.csic.es QuerolX., Alastuey A., Viana M.M. Institute of Earth Sciences CSIC, Barcelona, SPAIN EMEP-TFMM workshop, Paris 29 November 2006
Outline D.G. Calidad y Evaluación Ambiental (MMA)- CSIC-INM (MMA) EVALUATION OF PM POLLUTION IN SPAIN Summary of a 1999-2006 report: Atmospheric particulate matter in Spain: levels, composition and source origin X. Querol, A. Alastuey, T. Moreno, M.M. Viana, S. Castillo, J. Pey, S. Rodríguez, A. Cristóbal, S. Jiménez, M. Pallarés, J. de la Rosa, B. Artíñano, P. Salvador, M. Sánchez, S. García Dos Santos, M.D. Herce Garraleta, R. Fernández-Patier, S. Moreno-Grau, L. Negral, M.C. Minguillón, E. Monfort, M.J. Sanz, R. Palomo-Marín, E. Pinilla-Gil, E. Cuevas • Methodology for PM measurements and sampling • PM levels and speciation • Source contribution • Trace metals • Conclusions
Methodology: PM levels & speciation 2001 2002-2003 2002-2004 2002-2006 2004 1999-2000 45ºN 45ºN Mar Mar Cantábrico Cantábrico Bemantes LLodio L’Hospitalet Montseny Burgos + Sagrera + CSIC Monagrega Tarragona Alcobendas Morella Madrid (E.Aguirre) Palma Onda Alcora Vila-real, Borriana 40ºN 40ºN Océano Atlántico Puertollano El Saler Badajoz Mar Mediterráneo Cartagena 0 - - 500 m M. Lois 500 500 - - 1000 m 1000 1000 - 1500 m Algeciras-La línea Los Barrios >1500 m >1500 m >1500 m 10ºW 10ºW 0º 0º 5ºE 5ºE 35ºN 35ºN 5ºW 5ºW 28º25’N 28º25’N 28º25’N Santa Cruz Izaña El Río Mercado Central 28º00’N 28º00’N 28º00’N Sardina 16º40’W 16º40’W 16º40’W 15º40’W 15º40’W 15º40’W
EC Limit Value since 2005 EU Parliament Limit Value WHO-2005 Guidelines Barcelona Sagrera Barcelona CSIC Cartagena BA Alcobendas L’Hospitalet Puertollano Los Barrios Las Palmas Santa Cruz Cartagena Tarragona La Línea L’Alcora Vila-real Mallorca Badajoz Burgos Huelva Madrid Llodio Onda Suburban Suburban Rural Urban Urban Industrial Tr affic Industrial US EPA urban and industrial background EU Parliament Target Value 3 30 /m EC Target Value since 2010 g µ 20 2.5 PM 10 Barcelona Sagrera Barcelona CSIC Alcobendas L’Hospitalet Las Palmas Puertollano Monagrega Santa Cruz Cartagena Tarragona Bemantes Montseny La Línea Mallorca L’Alcora Vila-real Badajoz Burgos Huelva Madrid Llodio 0 Onda PM10 & PM2.5 total values 50 40 3 30 /m g µ 10 10 10 20 PM 10 Monagrega Montseny Bemantes 0
PM2.5:PM10/PM1:PM10 TRAFFIC/INDUSTRIAL URBAN BACKGROUND REGIONAL BACKGROUND 0.6/0.4 0.6/-- 0.6/0.4 0.7/0.5 0.6/0.5 0.8/0.7 0.7/0.6 0.7/0.5 0.6/-- 0.6/-- 0.7/-- 0.7/--- 0.6/-- 0.6/0.5 0.7/-- 0.6/0.5 0.7/--- 0.7/--- 0.5/-- 0.5/-- 0.6/-- 0.5/--- 0.7/--- 0.5/0.5 0.5 /-- 0.5/0.4 0.7/0.6 0.6/0.5 0.7/0.5 0.4/0.2 0.6/0.4 0.4/0.2
Canary Islands PM10 PM2.5 Crustal Crustal 12-25%, 2-5 µg/m3 Regional backg. 23-31%, 8-12 µg/m3Urban backg. 26-33%, 13-15 µg/m3 Traffic-industrial (8-10) 8-11%, 1-2 µg/m3 Regional backg. 9-17%, 3 µg/m3 Urban backg. 12-16%, 4-6 µg/m3 Traffic-industrial (15-20) (3-5) 9-17%, 3 µg/m3 Urban backg. 12-16%, 4-6 µg/m3 Traffic-industrial Areas with high industrial primary PM emissions EC + OM EC + OM 10-26%, 2-5 µg/m3 Regional backg. 12-32%, 5-10 µg/m3 Urban backg. 24-38%, 10-18µg/m3 Traffic-industrial 22-34%, 2-5 µg/m3 Regional backg. 25-45%, 5-10 µg/m3 Urban backg. 39-51%, 10-18µg/m3 Traffic-industrial Secondary inorganic species Secondary inorganic species 28-36%, 5-8 µg/m3 Regional backg. 20-27%, 6-11 µg/m3 Urban backg. 16-31%, 8-15 µg/m3 Industrial 30-35%, 4-5 µg/m3 Regional backg. 21-33%, 5-9 µg/m3 Urban backg. 20-38%, 8-12 µg/m3 Industrial Marine aerosols Marine aerosols 1 µg/m3 Iberian Peninsula 2- 4 µg/m3 Coastal zones 10-12 µg/m3 Canary Islands 0.5 µg/m3 Iberian Peninsula 1-1.5 µg/m3 Coastal zones 1.5-2 µg/m3 Canary Islands PM speciation Spain
NaNO3 Ca(NO3)2 Thermal instability of NH4NO3 along the year Seasonal trend J F M A M J J A S O N D * Zabalza et al., 2006 NH4NO3 Major specie (excluding Canary Isl.) EMEP * NO3-(µg/m3) PM10 <1 1-2 2-3 3-4 4-5 >5
Na2SO4 CaSO4 External origin Seasonal trend J F M A M J J A S O N D * Zabalza et al., 2006 EMEP (NH4)2SO4 Major specie * 2.5 nmSO42-(µg/m3) PM10 <3 3-4 4-5 5-6 6-7
* Zabalza et al., 2006 No local C sources Maximal dispersion, Trade winds Seasonal trend J F M A M J J A S O N D <3 3-5 5-7 7-10 10-15 15-18 * OM+EC(µg/m3) PM10
* Zabalza et al., 2006 Low re-suspension Influence from Traffic Influence from Traffic African contribution <3 3-5 5-7 7-10 10-15 15-18 * Mineral matter (µg/m3) PM10 Seasonal trend J F M A M J J A S O N D
Summer max Feb-Mar max (dust) Winter min African dust outbreaks: Influence on PM10:Monagrega Regional Background 1996 1997 1998 1999 1995 Daily PM10 limit value 1999/30/EC (50 g m-3) 54 out of 64 exceedances in 11 years caused by dust outbreaks African dust outbreaks high influence on number of exceedances of DLV but not on the annual mean
<2 2-3 3-4 4-5.6 Mineral matter (µg/m3) PM2.5
* Zabalza et al., 2006 Constant inputs and insolation Seasonal trend Na+ Cl- J F M A M J J A S O N D <1 1-2 2-3 3-5 5-10 10-12 * Marine aerosol (µg/m3) PM10
<1 1-2 2-3 3-5 5-10 10-12 Marine aerosol(µg/m3) PM2.5
U Barcelona 10-10-2005 to 08-01-2006 n=22 PM10/PM2.5/PM1 crustal load
Barcelona 10-10-2005 to 08-01-2006 n=22 PM10/PM2.5/PM1 crustal load
PM2.5 5.4 µg/m3 mineral Urban background 19% 0.5-1.5 Soil re-susp. 28% Regional 40% 1-2 1.3-3 Local road 41% 1-3.5 0.3-1 African dust 12% Annual mean mineral contribution to PM10 and PM2.5 at traffic hot spots in Most Iberian Peninsula (excluding South) PM10 12.5 µg/m3 mineral matter Urban background 36% Regional 32% 2-7 Soil re-suspension 20%. 1-4 3-5 African dust 12% 1-2 3-5 Local road 32% Southern Iberian Peninsula, Balearic and Canary Islands African dust increases to 2-5 µg/m3 PM10 on an annual average
CONCLUSIONS • PM10 and PM2.5 limit and target values are not met at hotspots in urban agglomerations • Daily limit value more strict than the annual daily limit value and many stations will not met this requirement • A detailed speciation study has been carried out for PM10, PM2.5 and PM1 in different sites of Spain • Source apportionment analysis revealed sources of PM and different scenarios are present in the country (most with high road traffic load, and a few with high industrial loads) • Large contribution of unaccounted mass for model outputs obtained for regional background sites (water/PM ratio increases in ‘clean’ environments) • SIA gradient: increase from Atlantic to towards Mediterranean side of Spain concerning the regional-SIA load. The ‘regional contribution source’ (up to 30% of PM10 in regional background sites) mixture of sources contributing to SIA and SOA • Seasonal trends of low stability species (such as NO3-) and photochemically dependent species (SO42-) arising from a single source may give rise to erroneous source differentiations by receptor modeling • Identification and quantification of contributions to the ‘crustal mixture’ (25 to 35% of the PM10 mass in urban areas, with a marked North to South increasing gradient • Out of some specific industrial hotspots, no major problems are expected to limit and target values for metals
Thank you for your attention ! xavier.querol@ija.csic.es Acknowledgements: TFMM-EMEP Ministry of the Environment of Spain, Ministry of Education and Sciences of Spain Regional AQ monitoring networks: Generalitat Valenciana, Generalitat de Catalunya Andalucía, Baleares, Canarias, Castilla-León, Castilla la Mancha, Euskadi, Extremadura, Galicia, Madrid, Murcia