Download
1 / 33
330 likes | 333 Views
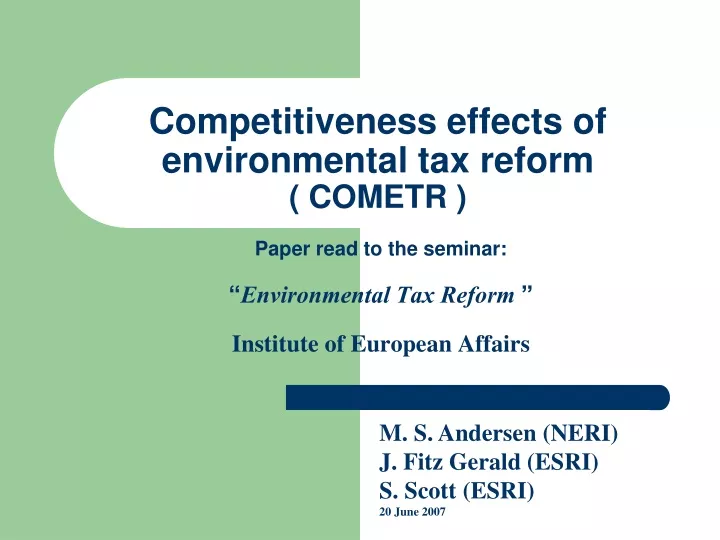
Competitiveness effects of environmental tax reform ( COMETR ). Paper read to the seminar: “ Environmental Tax Reform ” Institute of European Affairs. M. S. Andersen (NERI) J. Fitz Gerald (ESRI) S. Scott (ESRI) 20 June 2007. Outline of talk. COMETR an ex post study

E N D
Competitiveness effects of environmental tax reform( COMETR ) Paper read to the seminar: “Environmental Tax Reform ” Institute of European Affairs M. S. Andersen (NERI) J. Fitz Gerald (ESRI) S. Scott (ESRI) 20 June 2007
Outline of talk • COMETR an ex post study • ETR background • Competitiveness issues • Pricing power • Technology • Macro
COMETR Competitiveness Effects of Environmental Tax ReformA Specific Targeted Research Project (STREP) of the ‘Scientific Support to Policies’ initiative under the EU’s Sixth Framework Programme for Research (FP6) Partners: • Cambridge Econometrics • ESRI Dublin • Institute for Economic and Environmental Policy, Prague • Policy Studies Institute, London • Vienna Institute for International Economics • NERI, Aarhus University (coordinator) Modules: • Conceptual: revenue-neutral carbon tax and competitiveness issues • Sectors vulnerable to competition - Pricing power • Micro sectoral effects - technology potential • Macroeconomic effects • Case studies - threat of relocation ’carbon leakage’ • Mitigation and compensation mechanisms.
Competitiveness definition Competitiveness is lost if cost of production rises relatively faster than for competitors • Share of global production and export intensity decrease, and import penetration rises • A sustained loss in standard of living.
ETR background • EC 1990 proposed carbon/energy tax + rev recycling Least cost strategy. Encourages technology. Targets the true objective. • 6 EU states implemented ETR of this sort 1990 Sweden 1992 Denmark 1996 Netherlands 1997 Finland 1998 Germany 1999 UK • Detail:Energy-environment taxes introduced as part of policy to lower income taxes for employees (SW, FN). Employers’ social security contributions replaced by climate change levy/CO2 taxes (UK, DK). Mixed approach, recycling split between employers and employees (DE, NL).
Competitiveness issues Labour intensive sectors have little to fear. • Potentially vulnerable? Energy intensive Trade intensive Low abatement potential, and • Low pricing power ? • Lose market share? Close down? Relocate?
Potentially vulnerable sectors to be analysed for pricing power Pulp, paper and board Wood and products Basic chemicals Pharamaceuticals Non-metallic mineral products Basic metals Food and beverages
Pricing power explored Using sector’s past behaviour on cost increases: • Output price externally determined? ( price-taker, vulnerable ) OR • Mark-up on domestic costs? ( price-setter, market power, less vulnerable ) This question was tested using an econometric model for ETR countries.
Results on pricing power:Sectors ranked from most vulnerable
Conclusions: vulnerability Important differences in PRICING POWER Sectors can be assessed and ranked: Basic metals has least pricing power (most vulnerable), Non-metallic mineral products has most pricing power (least vulnerable). • Can prioritise sectors in policies to alleviate vulnerability Where the foreign price is dominant it is the EU price (not US or world price) • EU-wide ETR application effective.
How to reduce vulnerability? • Negotiated agreements – e.g. UK CCA 80% rebate on CCL • Exemptions – but problems of EU State Aid rules ! • Reduced rates - to sectors or processes - above certain thresholds • Recycling – in addition to reducing labour taxes, earmark some revenue to energy efficiency subsidies e.g. UK Carbon Trust. • ETR was very modest !
Technology:UK Climate Change Agreements Specific energy consumption better than targets Chemicals
Technology:UK Climate Change Agreements Specific energy consumption better than targetsCement lime and plaster
Technology: UK Climate Change Agreements Specific energy consumption trends index Meat processing – mixed results
Technology: UK Climate Change Agreements Specific energy consumption better than targetsFerrous metal
Macro impact of ETR - emissions of GHGCambridge Econometrics E3ME
Conclusions: Competitiveness effects of environmental tax reform • Some sectors are potentially vulnerable • Fewer are truly threatened – e.g. Basic metals Use e.g. agreements • Technology was encouraged • EU-wide ETR would be best • Modest ETR in 6 countries had good results COMETR website: www2.dmu.dk/cometr/ Follow Link to conference pageReport with Policy Brief
Appendix: Price-setting model The following model is considered: pi = 0 + 1mci + pfi where for sector i pi = the domestic output price mci = the domestic marginal cost pfi = the foreign or world price (US or German prices) Specifically: Pd* = f(Pj , Rj , Wk ), where: Pd* = the long-run wholesale price for the sector’s domestic output Pj = the wholesale price index in the ‘competing’ country or bloc j Rj = the exchange rate with country or bloc j. PPP imposed Wk = the price index for domestic input factor k. Wage rates are used. Error Correction Model representation:
Appendix: nominal tax rates for industryEffective rates were lower. Idea of scale: initial Swedish rate is 10 to 12 $US per barrel of oil
Appendix: Technology scope:UK estimated abatement costs, example (ETSU)
Appendix: Technology scopeUK estimated abatement costs, example (ETSU)
Appendix: Micro analysis of energy intensity Ho : Carbon tax reduces energy intensity (consistent with Porter Ho ) Tested: savings in energy costs due to Δ energy intensity > Δ Costs due to new tax. Results: 19 out of 32 tested positive (consistent). Inconsistencies can be explained by low tax rate or low energy intensity, except: Cement (FN):high tax, high intensity but no improvement .
Appendix: micro study of change in competitiveness Details of nine losses of competitiveness:
Appendix: Ireland’s possible ETR 1994 Losers / gainers: Net effect of carbon tax with reduction in social insurance contributions –£ m, first round effects, O’Donoghue 1997 ESRI WP no. 82
Appendix: Ireland Energy elasticities(EPA-ERTDI paper by Bergin, Fitz Gerald et al. 2004)
Appendix cont’d: Ireland Electricity elasticities(EPA-ERTDI paper by Bergin, Fitz Gerald et al. 2004)
Appendix: Ireland’s proposed ETREffects on prices in 2003 of Tax of €20 a tonne of CO2(EPA-ERTDI paper by Bergin, Fitz Gerald et al. 2004)
Appendix: Ireland - proposed ETR (EPA-ERTDI paper by Bergin, Fitz Gerald et al. 2004)