Download
1 / 13
130 likes | 132 Views
Vascular mortality: Age-specific hazard ratios for 20 mmHg lower usual SBP. Cause of death. Age at risk. No. of deaths. Stroke. 40-49. 414. 0·36 (0·32-0·40). 50-59. 1372. 0·38 (0·35-0·40). 60-69. 2939. 0·43 (0·41-0·45). 70-79. 4327. 0·50 (0·48-0·52). 80-89. 2636.

E N D
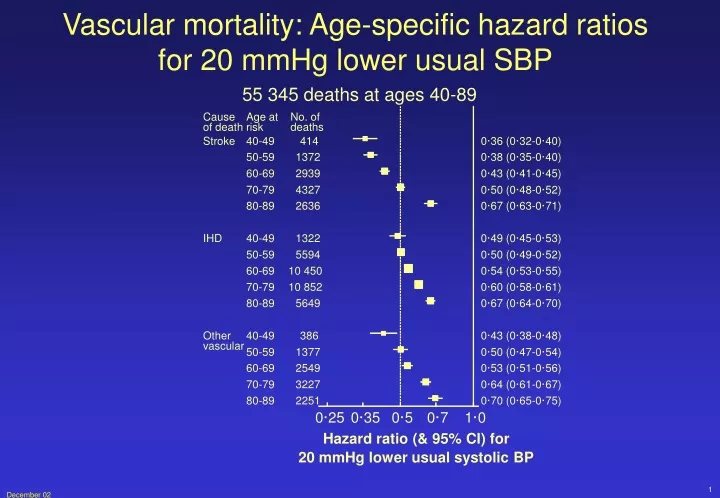
Vascular mortality: Age-specific hazard ratios for 20 mmHg lower usual SBP Cause of death Age at risk No. of deaths Stroke 40-49 414 0·36 (0·32-0·40) 50-59 1372 0·38 (0·35-0·40) 60-69 2939 0·43 (0·41-0·45) 70-79 4327 0·50 (0·48-0·52) 80-89 2636 0·67 (0·63-0·71) IHD 40-49 1322 0·49 (0·45-0·53) 50-59 5594 0·50 (0·49-0·52) 60-69 10 450 0·54 (0·53-0·55) 70-79 10 852 0·60 (0·58-0·61) 80-89 5649 0·67 (0·64-0·70) Other vascular 40-49 386 0·43 (0·38-0·48) 50-59 1377 0·50 (0·47-0·54) 60-69 2549 0·53 (0·51-0·56) 70-79 3227 0·64 (0·61-0·67) 80-89 2251 0·70 (0·65-0·75) 0·25 0·35 0·5 0·7 1·0 Hazard ratio (& 95% CI) for 20 mmHg lower usual systolic BP 55 345 deaths at ages 40-89 1
Vascular mortality: Age-specific hazard ratios for 10 mmHg lower usual DBP (³ 75 mmHg) Cause of death Age at risk No. of deaths Stroke 40-49 348 0·35 (0·30-0·40) 50-59 1243 0·34 (0·32-0·37) 60-69 2626 0·40 (0·38-0·42) 70-79 3915 0·48 (0·45-0·51) 80-89 2340 0·63 (0·58-0·69) IHD 40-49 1114 0·47 (0·43-0·51) 50-59 4945 0·52 (0·50-0·55) 60-69 9289 0·56 (0·54-0·58) 70-79 9727 0·62 (0·60-0·64) 80-89 5068 0·70 (0·65-0·74) Other vascular 40-49 316 0·43 (0·37-0·50) 50-59 1140 0·48 (0·44-0·52) 60-69 2220 0·49 (0·46-0·53) 70-79 2853 0·61 (0·57-0·66) 80-89 1976 0·71 (0·64-0·79) 0·25 0·35 0·5 0·7 1·0 Hazard ratio (& 95% CI) for 10 mmHg lower usual diastolic BP 49 120 deaths at ages 40-89 ³ 2
256 Age at risk: 20 mmHg SBP 128 80-89 33% risk 64 70-79 50% risk 32 60-69 57% risk 16 Stroke mortality (floating absolute risks & 95% CI) 50-59 62% risk 8 (40-49 64% risk) 4 2 1 120 140 160 180 Usual systolic blood pressure (mmHg) Stroke mortality rate in each decade of age versus usual SBP at the start of that decade 11 274 deaths at ages 50 - 89 3
Age at risk: 10 mmHg SBP 256 80-89 37% risk 128 70-79 52% risk 64 60-69 60% risk 32 Stroke mortality (floating absolute risks & 95% CI) 50-59 66% risk 16 (40-49 65% risk) 8 4 2 1 70 80 90 100 110 Stroke mortality rate in each decade of age versus usual DBP at the start of that decade 11 274 deaths at ages 50 - 89 Usual diastolic blood pressure (mmHg) 4
Age at risk Sex No. of deaths 40-49 Male 279 0·33 (0·29-0·38) Female 135 0·41 (0·34-0·49) Both 414 0·36 (0·32-0·40) 50-59 Male 989 0·34 (0·32-0·37) Female 383 0·45 (0·40-0·50) Both 1372 0·38 (0·35-0·40) 60-69 Male 2116 0·41 (0·39-0·44) Female 823 0·47 (0·43-0·51) Both 2939 0·43 (0·41-0·45) 70-79 Male 2599 0·48 (0·46-0·51) Female 1728 0·53 (0·49-0·56) Both 4327 0·50 (0·48-0·52) 80-89 Male 1238 0·68 (0·63-0·75) Female 1398 0·65 (0·60-0·71) Both 2636 0·67 (0·63-0·71) 0·25 0·35 0·5 0·7 1·0 Stroke mortality: Age- and sex-specific hazard ratios for 20 mmHg lower usual SBP 11 688 deaths at ages 40-89 Hazard ratio (& 95% CI) for 20 mmHg lower usual systolic BP 5 xif.ctrl: 22-MAY-2002 15:16:20.58
Age at risk Type of stroke No. of deaths 40-49 S.A.H. 150 0·44 (0·36-0·53) C. Haem 157 0·31 (0·26-0·38) C. Isch 46 0·44 (0·31-0·64) Unknown 61 0·29 (0·22-0·39) Any strokes 414 0·36 (0·32-0·40) 50-59 S.A.H. 301 0·50 (0·43-0·58) C. Haem 462 0·38 (0·34-0·43) C. Isch 177 0·35 (0·29-0·41) Unknown 432 0·34 (0·30-0·38) Any strokes 1372 0·38 (0·35-0·40) 60-69 S.A.H. 271 0·47 (0·40-0·55) C. Haem 741 0·43 (0·39-0·47) C. Isch 538 0·45 (0·41-0·51) Unknown 1389 0·44 (0·41-0·47) Any strokes 2939 0·43 (0·41-0·45) 70-79 S.A.H. 107 0·76 (0·58-0·99) C. Haem 915 0·51 (0·47-0·56) C. Isch 850 0·50 (0·45-0·55) Unknown 2455 0·49 (0·46-0·52) Any strokes 4327 0·50 (0·48-0·52) 80-89 S.A.H. 33 1·03 (0·56-1·89) C. Haem 423 0·51 (0·43-0·60) C. Isch 518 0·77 (0·67-0·87) Unknown 1662 0·67 (0·62-0·72) Any strokes 2636 0·67 (0·63-0·71) 0·25 0·35 0·5 0·7 1·0 Stroke mortality (by sub-type): Age-specific hazard ratios for 20 mmHg lower usual SBP 11 688 deaths at ages 40-89 Hazard ratio (& 95% CI) for 20 mmHg lower usual systolic BP 6
Age at risk 20 mmHg SBP 256 80-89 31% risk 128 70-79 40% risk 64 60-69 46% risk 32 50-59 50% risk IHD mortality (floating absolute risks & 95% CI) 16 40-49 51% risk 8 4 2 1 120 140 160 180 Usual systolic blood pressure (mmHg) IHD mortality rate in each decade of age versus usual SBP at the start of that decade 33 867 deaths at ages 40 - 89 7
256 Age at risk 10 mmHg DBP 80-89 30% risk 128 70-79 38% risk 64 60-69 44% risk 32 50-59 48% risk IHD mortality (floating absolute risks & 95% CI) 16 40-49 53% risk 8 4 2 1 70 80 90 100 110 Usual diastolic blood pressure (mmHg) IHD mortality rate in each decade of age versus usual DBP at the start of that decade 33 867 deaths at ages 40 - 89 8
Sex Age at risk No. of deaths 40-49 Male 1202 0·50 (0·46-0·54) Female 120 0·40 (0·32-0·49) Both 1322 0·49 (0·45-0·53) 50-59 Male 5027 0·50 (0·49-0·52) Female 567 0·49 (0·45-0·54) Both 5594 0·50 (0·49-0·52) 60-69 Male 8609 0·55 (0·54-0·57) Female 1841 0·50 (0·47-0·53) Both 10 450 0·54 (0·53-0·55) 70-79 Male 7384 0·62 (0·60-0·64) Female 3468 0·55 (0·53-0·58) Both 10 852 0·60 (0·58-0·61) 80-89 Male 2932 0·69 (0·65-0·73) Female 2717 0·64 (0·60-0·68) Both 5649 0·67 (0·64-0·70) 0·25 0·35 0·5 0·7 1·0 Hazard ratio (& 95% CI) for 20 mmHg lower usual systolic BP IHD mortality: Age- and sex-specific hazard ratios for 20 mmHg lower usual SBP 33 867 deaths at ages 40-89 9 xif.ctrl: 22-MAY-2002 15:16:20.58
256 Age at risk: 20 mmHg SBP 128 80-89 30% risk 64 70-79 36% risk 32 16 60-69 47% risk Other vascular mortality (not stroke or IHD) (floating absolute risks & 95% CI) 8 50-59 50% risk 4 (40-49 57% risk) 2 1 120 140 160 180 Usual systolic blood pressure (mmHg) Other vascular mortality rate in each decade of age versus usual SBP at the start of that decade 9790 deaths at ages 50-89 10
Other vascular mortality rate in each decade of age versus usual DBP at the start of that decade 256 Age at risk: 10 mmHg DBP 128 80-89 29% risk 64 70-79 39% risk 32 60-69 51% risk Other vascular mortality (not stroke or IHD) (floating absolute risks & 95% CI) 16 50-59 52% risk 8 4 (40-49 57% risk) 2 1 70 80 90 100 110 Usual diastolic blood pressure (mmHg) 9790 deaths at ages 50-89 11
Mortality from other vascular causes (not stroke or IHD): Hazard ratios for 20 mmHg lower usual SBP 9 790 deaths at ages 40-89 Cause of Mean age No. of death at death deaths Heart Failure 68 746 0·53 (0·48-0·59) Aortic Aneurysm 68 705 0·55 (0·49-0·62) Hypertensive HD 68 649 0·22 (0·20-0·25) Atherosclerosis 72 508 0·48 (0·42-0·55) Sudden death 60 553 0·49 (0·43-0·56) Inflammatory HD 67 320 0·63 (0·53-0·75) Rheumatic HD 64 255 0·74 (0·61-0·89) Other HD (excl. IHD) 69 1682 0·62 (0·58-0·67) Pulmonary embolism 67 296 0·72 (0·60-0·87) Other circulatory 65 182 0·56 (0·44-0·71) 0·25 0·35 0·5 0·7 1·0 Hazard ratio (& 95% CI) for 20 mmHg lower usual systolic BP 12
256 128 64 32 IHD mortality (floating absolute risks & 95% CI) 16 8 4 2 1 100 110 120 130 140 150 Usual mid blood pressure (mmHg) IHD mortality rate in each decade of age versus usual mid blood pressure at the start of that decade 33 867 deaths at ages 40 - 89 13