Download

1 / 25
250 likes | 254 Views
Executive Board meeting 13 August 2008. 1. Consumer prices 12-month change. Per cent. January 2002 – July 2008 . CPI. 20 per cent trimmed mean. Weighted median. CPI-ATE 1). CPIXE 2). 2. 1) CPI adjusted for tax changes and excluding energy products.

E N D
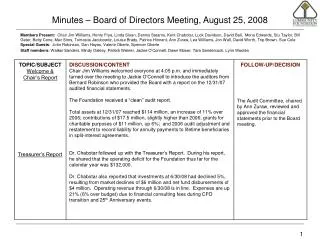
Consumer prices12-month change. Per cent. January 2002 – July 2008 CPI 20 per cent trimmed mean Weighted median CPI-ATE1) CPIXE2) 2 1)CPI adjusted for tax changes and excluding energy products. 2) CPIXE: CPI adjusted for tax changes and excluding temporary changes in energy prices Sources: Statistics Norway and Norges Bank
11 August 2008 Market after MPR 2/08 (25 June) Central bank interest rates and forward rates UK Norway Euro area Sweden US Sources: Thomson Reuters and Norges Bank
Money market rates Market after MPR 2/08 (25 June) MPR 2/08 Market 11 August 2008 Sources: Thomson Reuters and Norges Bank
CDS prices for US and European companies and selected banks. Basis points. 1 July 2007 – 11 August 2008 Merrill Lynch Citigroup UBS iTraxx Europe index JPMorgan Chase Source: Bloomberg
EquitiesIndices. 1 July 2007 = 100 25 June Emerging markets Norway, OSEBX US, S&P 500 Europe, Stoxx Japan, Topix Source: Thomson Reuters
Difference between three-month money market rates and expected key rates 1) Historic and ahead. Percentage points. UK Norway US Euro area 1) The expected key rate is measured by the Overnight Indexed Swap (OIS). For Norway, the estimates are based on key policy rate expectations in the market. Sources: Bloomberg, Thomson Reuters and Norges Bank
OECD leading indicatorsIndex. Historic average = 100. January 1995 – June 2008 OECD Euro area Sources: Thomson Reuters / OECD
Oil price (Brent Blend) in USD per barrelFutures prices (broken lines) International commodity prices1) Index. Week 1 2002 = 100 Week 1 2002 – week 32 2008 All items 20.06.08 (MPR 1/08) Industrials Metals Food Non-food agriculturals 11.08.08 1) In USD Sources: Thomson Reuters, Statistics Norway and Norges Bank
Rise in consumer prices abroad12-month change. Per cent. January 2002 – July 2008 Russia Brazil US Sweden UK India1) China Japan Euro area 1) Wholesale prices Source: Thomson Reuters
USInflation and long-term inflation expectationsMonthly figures. Per cent. January 2005 – July 2008 1) 5-10-year inflation expectations: Survey (University of Michigan) CPI CPI excl food and energy 10-year inflation expectations: ”break-even” (Real interest rate bonds) 10-year inflation expectations: swaps 1) CPI for January 2005 – June 2008 Sources: Bloomberg and Thomson Reuters
USInflation and implicit inflation expectations 1)Monthly figures. Per cent. January 2005 – July 2008 2) Implicit five-year inflation expectations in five years CPI CPI excl food and energy Implicit one-year inflation expectations in one year 1) Implicit one-year (five-year) inflation expectations in one year (five years) can be interpreted as expected one-year (five-year) inflation in one year (five years). Inflation expectations are based on inflation swaps from Bloomberg. 2) CPI for January 2005 – June 2008 Sources: Bloomberg and Thomson Reuters
Euro area Inflation and implicit inflation expectations1)Monthly figures. Per cent. January 2005 – July 2008 2) Implicit one-year inflation expectations in one year CPI Implicit five-year inflation expectations in five years CPI excl food and energy 1) Implicit one-year (five-year) inflation expectations in one year (five years) can be interpreted as expected one-year (five-year) inflation in one year (five years). Inflation expectations are based on inflation swaps from Bloomberg. 2) CPI for January 2005 – June 2008 Sources: Bloomberg and Thomson Reuters
US 2- and 10-year inflation expectationsPer cent. Daily figures. 2 January 2008 – 8 August 2008 2-year inflation expectations 10-year inflation expectations Sources: Bloomberg and Thomson Reuters
Real exchange rateDeviation from mean. Per cent. 1970 – 2007 Mean January – June 20081) Relative wage costs Relative consumer prices Average ”oil age” Sources: Statistics Norway, Technical Reporting Committee on Income Settlements, Ministry of Finance and Norges Bank 1) Data for 2008 based on observations to 8 August
Import and export prices4-quarter change. Per cent. 2000 Q1 – 2008 Q2 Traditional exports Traditional imports Source: Statistics Norway
Manufacturing production indexSeasonally adjusted volume index. 3-month moving average. January 2002 – June 2008 Capital goods Intermediate goods Trend Consumer goods 3-month moving average Source: Thomson Reuters
Bottle-necks in productionBusiness tendency survey. Per cent. 2004 Q4 – 2008 Q2 Demand and competition (left-hand scale) Labour supply (right-hand scale) Source: Statistics Norway
Employment (LFS)In 1000s of persons. Seasonally adjusted. June 2006 – May 2008 Sources: Statistics Norway and Norges Bank
House prices Monthly figures. January 1998 – July 2008 12-month change Annualised change in 3-month moving average Sources: Norwegian Association of Real Estate Agents, Association of Real Estate Agency Firms, ECON Pöyry and FINN.no
Building starts Area (1000 m2). Trend. January 2002 – May 2008 Other buildings Dwellings Source: Statistics Norway
Index of commodity consumption Volume. Seasonally adjusted. January 2005 – May 2009 Published in April Published in May Sources: Statistics Norway
Household net lendingTotal past four quarters. In billions of NOK. 2003 Q1 – 2008 Q1 National accounts Financial sector accounts (FINSE) National accounts, excluding reinvested dividends Sources: Statistics Norway and Norges Bank
Key policy rate, money market rate1) and bank lending rate on new loans2) In per cent. 3 May 2007 – 11 August 2008 Mortgage rate2) Money market rate Key policy rate 1) 3-month NIBOR. 2)Interest rates on new mortgage loans of NOK 1 million within 60% of purchase price with floating interest rate. Figures for the 20 largest banks, weighted according to market share. Sources: Norsk familieøkonomi AS and Norges Bank
Key policy rate Strategy interval 2/08 MPR 2/08 1/08 3/07 2/07 1/07 3/06 2/06 1/06 3/05 2/05 1/05 3/04 25 Source: Norges Bank