Download
1 / 19
330 likes | 617 Views
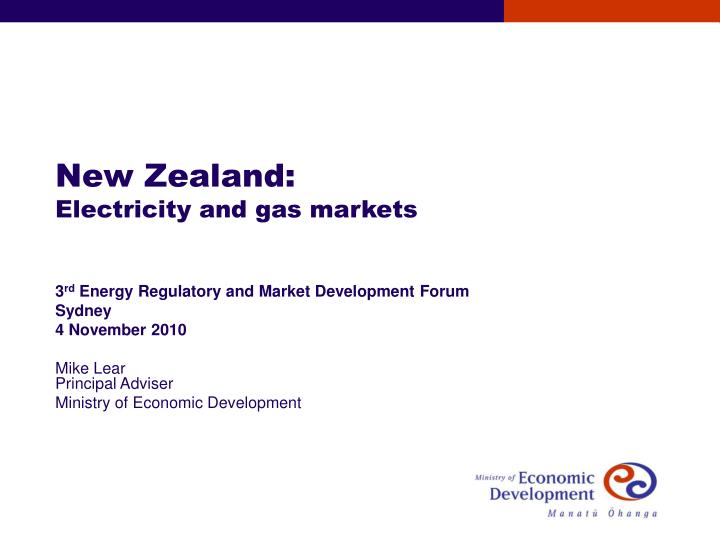
New Zealand: Electricity and gas markets. 3 rd Energy Regulatory and Market Development Forum Sydney 4 November 2010 Mike Lear Principal Adviser Ministry of Economic Development. New Zealand’s place in the world. Small population 4.4 million Two islands a long way from anywhere

E N D
New Zealand:Electricity and gas markets 3rd Energy Regulatory and Market Development Forum Sydney 4 November 2010 Mike LearPrincipal Adviser Ministry of Economic Development
New Zealand’s place in the world • Small population • 4.4 million • Two islands a long way from anywhere • Cannot import electricity • In the ‘Roaring Forties’ • Provides world class wind resource
Geologically challenging…. • Between the Pacific Plate and the Australian Plate • On the ‘Pacific Ring of Fire’ • provides world class geothermal resource • About 12 percent of total generation and growing
Plenty of water, usually… • Very good hydro resource • Usually around 60 percent of total generation • But • Small storage capacity (10% of annual demand) • Big difference between wet and dry years • Inverse correlation between main inflows (spring/summer) and main demand (winter) • Most of storage in South Island, most demand in North Island • Makes system volatile and hard to manage. Substantial thermal backup required • Dry years in 2001, 2003, 2006 and 2008 • Public conservation campaigns required 2001 and 2003 Geothermal Thermal Hydro
New Zealand’s power system • Installed generation 9500 MW • Peak demand (in winter) 6750 MW • Total energy supply 42,000 GWh/yr • Two AC island power systems • Connected by 700MW HVDC link • Power mainly transferred north, but south in dry years
Electricity generation to 2030 • Demand growth forecast ~1.5% pa • Coal-fired generation gone by 2020: becomes too expensive with carbon charge • Geothermal and wind • most economic new generation • expected to replace coal • renewables grow to 86% (from 72%) by 2030 • New generation build • open entry / no licences or approvals except environmental • no subsidies or special tariffs for renewables
Structure of NZ electricity industry * * * Other Mighty River Genesis Power Meridian Energy Contact Energy TrustPower Independent Co-Generation Generation Power Generators Wholesale Electricity Market * Transpower Transmission Other Vector Orion Powerco Distribution Distribution Companies * * * Mighty River Genesis Power Meridian Energy Contact Energy TrustPower Other Retailers Retail Power Residential Direct Supply Customers Commercial Industrial Consumers
Electricity market • 5 main generators • 3 state-owned enterprises (SOEs) • 2 privately owned • 1 system operator / grid owner-operator (SOE: Transpower) • 29 local lines companies • 11+ electricity retailers • Most generators and retailers are vertically integrated • Some separation rules apply between lines businesses and generation / retail businesses • Separation rules are a mix of ownership, corporate and behavioural
Wholesale market • Mandatory wholesale spot market: all grid-connected power must be offered into and bought from the half-hourly spot market • All generators receive price of most expensive generation required to be dispatched • Energy-only market (no capacity market or capacity payments) • Nodal prices: ~250 injection and offtake nodes (prices reflect transmission losses and constraints) • System operator dispatches generation in real time and operates the grid • Wholesale buyers may enter into financial hedges to reduce or avoid exposure to spot prices • Vertically integrated generator-retailers have an internal ‘natural’ hedge • Liquid hedge / futures market being developed (with mandatory participation by major generator-retailers) • Rules set by market regulator (Electricity Authority)
Spot prices are volatile…. • Daily average spot prices since the start of the wholesale market • Note sustained high spot prices in 2001, 2003, 2006 and 2008 dry years
Successful Sufficient new generation being built: supply margins maintained On-going pressure for efficiency Good diversity of generation build: least cost options built to time and budget Efficient prices Cross-subsidies eroded away Prices reflect (rising) cost of building new capacity Not so successful Retail margins have increased, especially for residential consumers Not enough retail competition, especially outside main centres and in South Island Poor management of security of supply in dry years Incentives on generator-retailers and major users to rely on and lobby for conservation campaigns Recent reforms address these issues SOE asset swaps Liquid hedge market Transmission hedges Lines allowed to undertake retailing Conservation campaigns will cost generator-retailers and major users Re-vamped regulator Outcomes
Gas market • Only reticulated in the North Island • LPG in South Island • Fully competitive but relatively concentrated market • Fully privately-owned • Main transmission and distribution pipeline owner is vertically integrated into wholesaling and retailing • Main uses • Electricity generation • Petrochemicals (swing user) • Commercial and residential: small
Gas supply • Gas market historically (25 years) dominated by large Maui field • Being replaced by a number of smaller fields • Much more complex to manage (standards, balancing, access to processing facilities and pipelines etc)
Plenty of potential….. • Current oil and gas producing fields are located only in the Taranaki basin (on-shore and off-shore) • Other basins appear attractive • ‘Petroleum Action Programme’ to promote interest in exploration
Gas market: institutional arrangements • Same as for electricity • with a notable exception: • Gas regulator is a private company: Gas Industry Co (GIC) • Jointly owned by all industry stakeholders (including demand-side) • Set up under legislation (6 years ago) • Majority of Board and chair are ‘independent’ persons (elected by shareholders of GIC) • Recommends regulations and rules to the Minister • Minister may only accept/reject/send back recommendations • GIC must deliver on government policy as set out in a Government Policy Statement • Reason for this set-up: ensure full industry involvement in rule-making • GIC has had successes, though has found it challenging to resolve entrenched industry disputes
Climate change policy: New Zealand’s emissions HFCs, PFCs, SF61% Carbon dioxide 47% Methane 35% Nitrous oxide 17% Industrial processes 6% Manufacturing industries 7% Fugitive emissions 2% Other sectors 4% Other 2% Waste 2% Energy industries 10% Transport 20% Beef 10% Dairy 23% Sheep 13% Energy43% Agriculture 48%
Putting a price on emissions • Full cap-and-trade emissions scheme introduced 2008 • Covers all sectors including agriculture • Assistance for emissions-intensive trade-exposed industry • No assistance for electricity and fuel companies • Timetable for sectors to enter the scheme