Download
1 / 28
280 likes | 401 Views
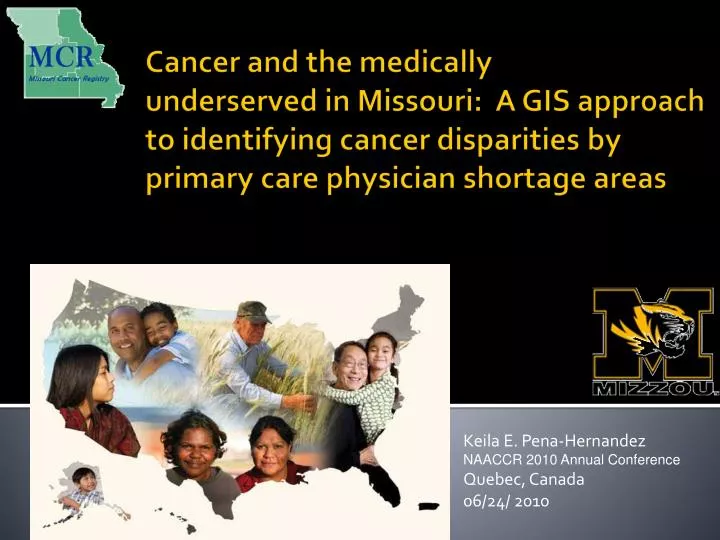
Cancer and the medically underserved in Missouri: A GIS approach to identifying cancer disparities by primary care physician shortage areas. Keila E. Pena-Hernandez NAACCR 2010 Annual Conference Quebec, Canada 06/24/ 2010. Missouri Cancer Registry.

E N D
Cancer and the medically underserved in Missouri: A GIS approach to identifying cancer disparities by primary care physician shortage areas Keila E. Pena-Hernandez NAACCR 2010 Annual Conference Quebec, Canada 06/24/ 2010
Missouri Cancer Registry • A collaborative partnership between the Missouri Department of Health & Senior Services (DHSS) and the University of Missouri - Columbia (MU) • Supported by a Cooperative Agreement between DHSS and the Centers for Disease Control and Prevention (CDC) and a Surveillance Contract between DHSS and MU (#U58/DP00820-03)
Acknowledgements For their assistance: • Director of Missouri Cancer Registry: Jeannette Jackson-Thompson, PhD, MPH • Research mentor: Mary Jane King, BS • Statistics specialist: Chester Schmaltz • Instant Atlas support staff: Dorothy Graves For their hard work and support of MCR: • Cancer registrars and other reporting facility staff
Purpose To understand factors that contribute towards cancer health disparities in Missouri
Cancer health disparities • According to the National Cancer Institute, cancer health disparities are defined as differences in the incidence, prevalence, mortality, and burden of cancer and related adverse health conditions that exist among specific population groups in the United States.
Health Disparity • “a population where there is a significant disparity [difference] in the overall rate of disease incidence, prevalence, morbidity, mortality, or survival rates in the population as compared to the health status of the general population”-Minority Health and Health Disparities Research and Education Act, 2000
What Determines Health? • Income and social status • Social support networks • Education and literacy, i.e. health literacy • Employment/Working conditions • Social environments • Physical environments • Life Skills • Personal health practices and coping skills • Healthy child development • Biology and genetic endowment • Health services • Gender • Culture
What is a Health Professional Shortage Area (HPSA)? • defined service areas that demonstrate a critical shortage of primary care physicians, dentists, or mental health providers • can be a distinct geographic area, a specific population group within a defined geographic area, or a specific public or non-profit facility
HPSA Designations http://www.dsf.health.state.pa.us/health/lib/health/primarycare/HPSADesBook.pdf
Background • Previous research has revealed that medically underserved populations are at higher risk of being diagnosed with late-stage cancer. • Rural populations also face financial, physical and cultural barriers that prevent them from obtaining effective health care.
Methods We examined contributing factors: • Health profession shortage areas (HPSAs): Low Income • Low income individuals with incomes at or below 200% of the federal poverty level. A minimum of 30% of the population within the rational service area must be low income in order to pursue this type of designation.
Methods continued… • Medically Underserved Areas/Populations (MUAs/MUPs) • areas or populations designated by HRSA as having: too few primary care providers, high infant mortality, high poverty and/or high elderly population. • Poverty Rate • percentage of people (or families) who are below poverty
Methods: Data Sources • Missouri Cancer Registry (MCR) • Cancer incidence data, 1996-2007 • Community Information Management (CIM) • Poverty, MUA, HPSA, State, County Boundaries
Preliminary analysis ArcGIS 9ArcMap –ArcViewVersion 9.3
HPSA & significantly high cancer rates, all sites 2004-2007 Significantly high cancer rates Significantly low cancer rates Madison Ripley
MUAs & significantly high cancer rates, all sites 2004-2007 Saline Medically Underserved Area St. Louis City & St. Louis County Significantly high cancer rates Madison Significantly low cancer rates Benton Ripley
Poverty rates & significantly high cancer rates, all sites 2004-2007 Significantly high cancer rates Significantly low cancer rates Ripley Butler
GIS Approach Instant Atlas Reports
InstantAtlas • Geographic Data Visualization Software • improves the visual communication of location-based statistical data.
Why InstantAtlas? • The ability of InstantAtlas to allow for quick and easy data reports while displaying statistical information on highly interactive maps allows the end-user to discover patterns, trends, relationships and anomalies.
HPSA –Low Income v. % late-stage cancer, all sites, 2004-2007
HPSA Low-incomevs. % Late-stage female breast cancer , 2004-2007
HPSA Low-incomevs. Age-adjusted Invasive Cancer Incidence Rate, Cervix, 1996-2007
HPSA Low-incomevs. Age-adjusted Invasive Cancer Incidence Rate ,Colon and Rectum, 2004-2007
Implications • Using GIS tools is a good starting point for investigating health disparities • Allows for the assessment of future needs in GIS studies relating to inequalities of HPSA groups • Provides evidence of the pivotal role of small area analysis for GIS and policy makers
Questions? • Any Questions? • Contact Information: E-mail: kep989@mail.missouri.edu