Download
1 / 1
10 likes | 261 Views
Evaluation of European Protocols to measure Nasal Potential Difference. Bronsveld I 1 , Sermet I 2 , Southern K 3 , Melotti P 4 , Middleton P 5 , Leal T 6 , Hjelte L 7 , Davies J 8 , Alton E 8 , Sinaasappel M 9 , De Boeck K 10 , Wilschanski M 11.

E N D
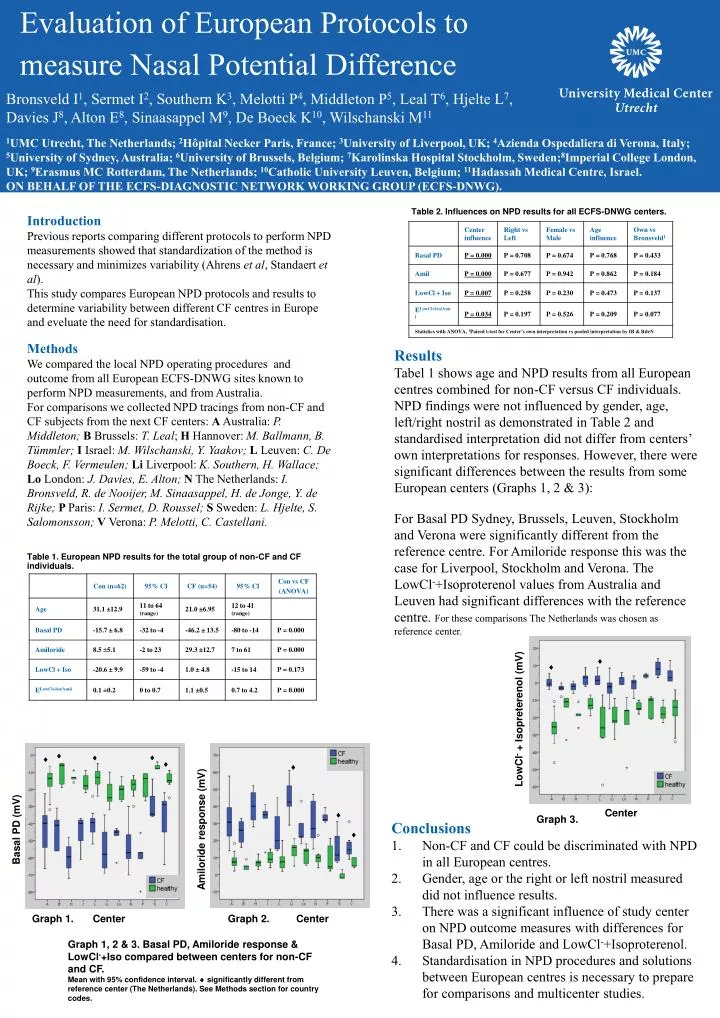
Evaluation of European Protocols to measure Nasal Potential Difference Bronsveld I1, Sermet I2, Southern K3, Melotti P4, Middleton P5, Leal T6, Hjelte L7, Davies J8, Alton E8, Sinaasappel M9, De Boeck K10, Wilschanski M11 1UMC Utrecht, The Netherlands; 2Hôpital Necker Paris, France; 3University of Liverpool, UK; 4Azienda Ospedaliera di Verona, Italy;5University of Sydney, Australia; 6University of Brussels, Belgium; 7Karolinska Hospital Stockholm, Sweden;8Imperial College London, UK; 9Erasmus MC Rotterdam, The Netherlands; 10Catholic University Leuven, Belgium; 11Hadassah Medical Centre, Israel. ON BEHALF OF THE ECFS-DIAGNOSTIC NETWORK WORKING GROUP (ECFS-DNWG). Table 2. Influences on NPD results for all ECFS-DNWG centers. Introduction Previous reports comparing different protocols to perform NPD measurements showed that standardization of the method is necessary and minimizes variability (Ahrens et al, Standaert et al).This study compares European NPD protocols and results to determine variability between different CF centres in Europe and eveluate the need for standardisation. Methods We compared the local NPD operating procedures and outcome from all European ECFS-DNWG sites known to perform NPD measurements, and from Australia. For comparisons we collected NPD tracings from non-CF and CF subjects from the next CF centers: A Australia: P. Middleton;B Brussels: T. Leal; H Hannover: M. Ballmann, B. Tümmler; I Israel: M. Wilschanski, Y. Yaakov; L Leuven: C. De Boeck, F. Vermeulen; LiLiverpool: K. Southern, H. Wallace; Lo London: J. Davies, E. Alton; N The Netherlands: I. Bronsveld,R. de Nooijer, M. Sinaasappel, H. de Jonge, Y. de Rijke;P Paris: I. Sermet, D. Roussel;SSweden: L. Hjelte, S. Salomonsson; V Verona: P. Melotti, C. Castellani. Results Tabel 1 shows age and NPD results from all European centres combined for non-CF versus CF individuals. NPD findings were not influenced by gender, age, left/right nostril as demonstrated in Table 2 and standardised interpretation did not differ from centers’ own interpretations for responses. However, there were significant differences between the results from some European centers (Graphs 1, 2 & 3): For Basal PD Sydney, Brussels, Leuven, Stockholm and Verona were significantly different from the reference centre. For Amiloride response this was the case for Liverpool, Stockholm and Verona. The LowCl-+Isoproterenol values from Australia and Leuven had significant differences with the reference centre. For these comparisons The Netherlands was chosen as reference center. Table 1. European NPD results for the total group of non-CF and CF individuals. LowCl- + Isopreterenol (mV) Center Graph 3. Amiloride response (mV) • Conclusions • Non-CF and CF could be discriminated with NPD in all European centres. • Gender, age or the right or left nostril measured did not influence results. • There was a significant influence of study center on NPD outcome measures with differences for Basal PD, Amiloride and LowCl-+Isoproterenol. • Standardisation in NPD procedures and solutions between European centres is necessary to prepare for comparisons and multicenter studies. Basal PD (mV) Graph 1. Center Graph 2. Center Graph 1, 2 & 3. Basal PD, Amiloride response & LowCl-+Iso compared between centers for non-CF and CF. Mean with 95% confidence interval. significantly different from reference center (The Netherlands). See Methods section for country codes.