Download

1 / 46
460 likes | 520 Views
D.C. Water Lead Levels Below Federal Limits Consumers Urged to Continue Precautions By D'Vera Cohn Washington Post Staff Writer Wednesday, May 11, 2005;

E N D
D.C. Water Lead Levels Below Federal Limits Consumers Urged to Continue Precautions By D'Vera Cohn Washington Post Staff Writer Wednesday, May 11, 2005; Lead levels in the District's drinking water have fallen substantially in recent months and dropped below the federal action limit for the first time in four years, the general manager of the D.C. Water and Sewer Authority said yesterday.
By Pierre Home-Douglas FIRST, MARC EDWARDS DISCOVERED HIGH LEVELS OF LEAD IN WASHINGTON, D.C.'S, DRINKING WATER, THEN HE HAD TO PERSUADE THE BUREAUCRACY TO GET THE WORD OUT. It was a problem that had baffled civil engineer Marc Edwards for a decade. By the time the Virginia Tech professor finally figured out the answer, he had stumbled across a health issue that ended up pitting him against the Environmental Protection Agency (EPA) and the utility that supplies Washington, D.C., with its drinking water. The resulting battle and stress affected his health, but Edwards persevered and was finally vindicated, assisted by three graduate students he credits with helping him through the ordeal.
Scale formation in pipes
Stalactites Stalagmites
FeS2 + 4O2 + 3H20 H2SO4 + Fe(OH)3
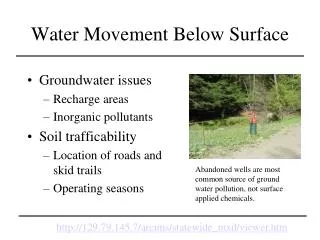
, pet waste, lawns Newton, UW-APL
Onsite Septic N Project State Legislature Appropriation to the PSAT M. Brett et al The objective of this project is to measure nitrogen removal rates from septic system drainfield plumes for OSSs located in the Hood Canal watershed. These data are needed to estimate the potential N loading to the Hood Canal from OSSs …. project report with the state legislature by the end of June, 2007.
7 KIT02 House S Tap Drainfield 8 9 1 2 3 4 5 6 X X 12 11 cutbank 13 5 4 3 2 1
The impact of waste water diversion on Lake Washington phosphorus loading 125 Sewage Effluent 100 Watershed Loading 75 Dissolved P Inputs (metric tons yr.-1) 50 25 0 1965 1970 1975 1980 1985 1990 Year From: W.T. Edmondson (1994) Lake & Reservoir Management 10: 75-84.
Change in Lake Washington phytoplankton composition and biomass Cyanobacteria 3 OtherPhytoplankton 2 Phyto. Bioviol. (mm3 L-1) 1 0 1965 1970 1975 1980 1985 1990 Year From: W.T. Edmondson (1994) Lake & Reservoir Management 10: 75-84.
Change in Lake Washington nutrient concentrations, and phytoplankton biomass after waste water diversion 125 100 Inorganic Carbon 75 Nitrate Percent of 1964 Value Phosphate 50 Phytoplankton 25 0 1965 1970 1975 Year From: W.T. Edmondson (1991) The Uses of Ecology.
0 0 -1 5 Daphnia 2 10 Daphnia L 15 4 Trophic Equilibrium 20 Secchi (m) 6 8 Secchi Depth 10 1965 1970 1975 1980 1985 1990 Year The impact of waste water diversion on Lake Washington water clarity From: W.T. Edmondson (1994) Lake & Reservoir Management 10: 75-84.
Global average temperature 0.8 0.4 degrees Celsius 0 -0.4 -0.8 1860 1880 1900 1920 1940 1960 1980 2000
Consequences of Global Warming for the PNW • Shorter ski seasons • More winter flooding • Increased landslide risk due to rain on snow events • Reduced summer flows • Water supply shortages • More catastrophic forest fires • Agricultural water shortages in Eastern W • Further-stressed salmon runs
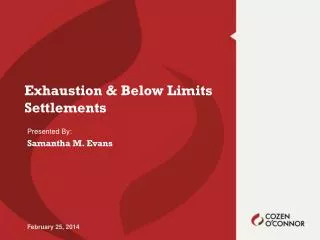
The South Cascade glacier retreated dramatically in the 20th century 1928 Courtesy of the USGS glacier group 2000
Decrease Increase Mote 2003(b)
As the West warms, winter flows rise and summer flows drop Figure by Iris Stewart, Scripps Inst. of Oceanog. (UC San Diego)


![[click to continue]](https://cdn3.slideserve.com/6656740/slide1-dt.jpg)