Download
1 / 12
120 likes | 209 Views
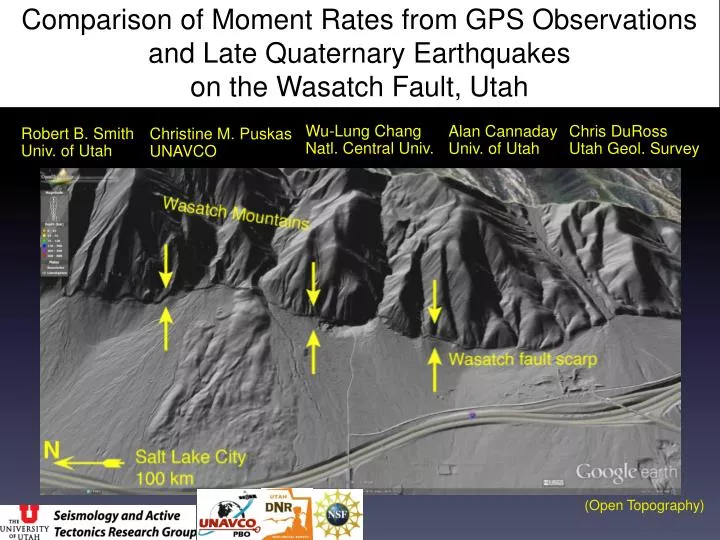
Comparison of Moment Rates from GPS Observations and Late Quaternary Earthquakes on the Wasatch Fault, Utah. Wu-Lung Chang Natl. Central Univ. Alan Cannaday Univ. of Utah. Chris DuRoss Utah Geol. Survey. Robert B. Smith Univ. of Utah. Christine M. Puskas UNAVCO. (Open Topography).

E N D
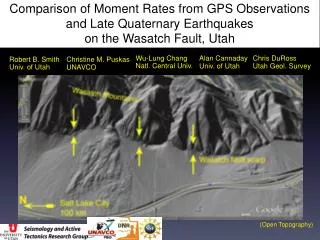
Comparison of Moment Rates from GPS Observations and Late Quaternary Earthquakes on the Wasatch Fault, Utah Wu-Lung Chang Natl. Central Univ. Alan Cannaday Univ. of Utah Chris DuRoss Utah Geol. Survey Robert B. Smith Univ. of Utah Christine M. Puskas UNAVCO (Open Topography)
Wasatch Front Earthquakes 1962-2011 Major Faults in Northern Utah • Seismic zone with frequent microearthquakes • Largest historic quake was 1934 M6.6 Hansel Valley • Trenching studies have dated prehistoric events on Wasatch, other faults
Regional westward extension at Wasatch Front • Boundary of eastern Basin and Range and Stable North America • Earthquakes correlate with deformation • Compare energy stored through deformation and released in earthquakes
Horizontal and Vertical Velocities • Plate Boundary Observatory/University of Utah operate GPS stations • University of Utah processes data and monitors regional deformation • 55 stations in network across Utah and Wasatch Front • Updated processing software in 2011 • Bernese 5 replaced version 4.2 • Improved station positions • Data available at university web site: • www.uusatrg.utah.edu Eastern Basin-Range Stable North America
GPS Station Distribution and Wasatch Fault Segments • GPS stations grouped into profiles across northern, central, southern fault zone • North = Brigham City segment • Center = Salt Lake City segment • South = Nephi segment + part of Provo segment • Define boxes for each segment to use in loading calculations
Brigham City Profile Salt Lake City Profile Nephi Profile 3.18E23 dyne cm/yr geodetic loading (BC only) 6.71E23 dyne cm/yr geodetic loading (SLC only) 6.13E23 dyne cm/yr geodetic loading (SLC only) 2.75 mm/yr net extension rate 2.35 mm/yr net extension rate 2.17 mm/yr net extension rate 110-km wide seismic zone 80-km wide seismic zone 50-km wide seismic zone
Strain Rate Magnitude Shear Strain Rate • Interpolate horizontal GPS velocities to strain rates • Eliminate outliers SLCU and GOUT • Higher strain rates reflect larger changes of deformation over smaller areas
Geodetic Moment Loading Rate (Ward, 1998) • Use Kostrovformula to convert deformation rate to geodetic moment rate • Moment is measure of energy required for deformation • Moment available for earthquakes depends on: • Seismogenic volume • Strain rate for network area
Prehistoric Earthquakes Identified for Wasatch Fault (DuRoss et al., 2011) • 4-5 earthquake on each segment • Events dated within last 6000 years
Brigham City Profile Salt Lake City Profile Nephi Profile • 1-D horizontal dislocations for fault creeping at depth • Model predicts smoothly varying surface velocities • Width of deformation zone: ~65 km • Deformation amplitude depend on dip, slip rate • Observed GPS velocity profiles • 2-D station distribution with more complex deformation • Have at least 100-km wide deformation zone
Conclusions • Improved analysis lead to better match between geodetic moment loading rate and seismic moment release rate • Geodetic moment rate still exceeds paleoearthquake moment rate by up to 25% • Wasatch fault is major source of deformation, seismic moment • Other faults contribute to regional deformation • EGSL, East Cache, Oquirrh fault • Geodetic data consistent with complex block model of Wasatch Front, where regional extension accommodated on multiple faults