Download
1 / 45
450 likes | 610 Views
Soundings and Adiabatic Diagrams for Severe Weather Prediction and Analysis Continued. Shear vs. CAPE. Need a balance between Shear and CAPE for supercell development Without shear: single, ordinary, airmass thunderstorm which lasts 20 minutes

E N D
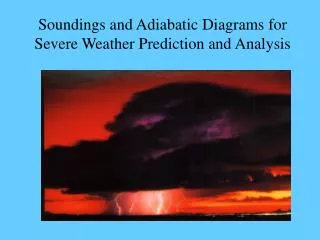
Soundings and Adiabatic Diagrams for Severe Weather Prediction and Analysis Continued
Shear vs. CAPE • Need a balance between Shear and CAPE for supercell development • Without shear: single, ordinary, airmass thunderstorm which lasts 20 minutes • If shear is too strong: multicellular t-storms (gust front moves too fast)
Shear Classification: • Two Main types: Directional and Speed • Bulk Shear: The Boundary Layer through 6 km (or higher) above ground level shear vector denotes the change in wind throughout this height. • Usually given in units of knots • Thunderstorms tend to become more organized and persistent as vertical shear increases. Supercells are commonly associated with vertical shear values of 35-40 knots and greater through this depth • Doesn’t take into account elevated parcels: • Effective Shear (kts) • Bulk Richardson Number shear (m^2/s^2)
Shear Just Right • 2-D equilibrium: squall line develops • 3-D equilibrium: right moving and left moving supercells A B A B L Left Mover L Right Mover
Bulk Richardson Number BRN = CAPE ½ (Uz2) Where Uz = the vertical wind shear (averaged over 3-6km layer) • In general: 15-40 favors supercell development >40 favors multicellular type storms • Explains the balance between wind shear and convective energy
Bulk Richardson Number (BRN) BRN= CAPE 1/2Uz2 (where Uz is a measure of the vertical wind shear)
V South Hodographs • Draw wind vectors in direction they are going • This is opposite of how the wind barbs are drawn U East West Wind speed North
Storm Splitting: R and L storm cells move with mean wind but drift outward Straight Line Shear 500 700 850 900 1000
Curved Hodograph • Emphasizes one of the supercells • Veering (clockwise curve): • right moving supercells • warm air advection in northern hemisphere • Backing (counter clockwise curve): • left moving supercells • warm air advection in southern hemisphere 700 300 500 850 900 1000
Straight Line Hodograph Curved hodograph
Can be thought of as a measure of the “corkscrew” nature of the winds. Higher helicity values relate to a curved hodograph. large positive values--> emphasize right cell large negative values--> emphasize left cells Values near zero relate to a straight line hodograph. Helicity H = velocity dotted with vorticity = V • ζ = u (dyw - dzv) - v (dxw - dzu) + w (dxv - dyu)
CAPE and Helicity • Plainfield, IL tornado: • CAPE=7000 • Helicity=165 • Energy Helicity:
What to take away from this event…? Dynamics/Shear dominate heat energy! • Strong mid/upper level shortwave trough • Strong dynamical forcing/frontal forcing • Strengthening surface low • Cold temperatures: <70F • Very small CAPE values: <1000J/kg • Bulk Shear: 80+ kts !!! • Helicity: 500+ m^2/s^2 !!! • Clockwise Hodographs favoring right moving cells • Perfect situation for low topped discrete supercells capable of producing tornadoes near triple point.
K Index • This index uses the values for temperature (t) and dew point temperature (td), both in oC at several standard levels. K = t850 - t 500 + td850 - t700 + td700
Vertical Totals VT = T850 - T500 • A value of 26 or greater is usually indicative of thunderstorm potential.
Cross Totals CT =T d850 - T500
Total Totals (TT) TT = VT + CT =T850 + T d850 - 2 T500
SWEAT (severe weather threat) Index SWI = 12D + 20(T - 49) + 2f8 + f5 + 125(S + 0.2) where: D=850mb dew point temperature (oC) (if D<0 then set D = 0) T = total totals (if T < 49 then set entire term = 0) f8=speed of 850mb winds (knots) f5= speed of 500mb winds (knots) S = sin (500mb-850mb wind direction) And set the term 125(S+0.2) = 0 when any of the following are not true • 850mb wind direction is between 130-250 • 500mb wind direction is between 210-310 • 500mb wind direction minus 850mb wind direction is positive • 850mb and 500mb wind speeds > 15knots
SWEAT (severe weather threat) Index SWI = 12D + 20(T - 49) + 2f8 + f5 + 125(S + 0.2)
Lifted Index (LI) • Compares the parcel with the environment at 500mb. LI = (Tenv-Tparcel)500
Best Lifted Index • Uses the highest value of qe or qwin the lower troposphere. • Use the highest mixing ratio value in combination with the warmest temperature. • SELS Lifted Index • Use the mean mixing ratio and mean q of the lowest 100mb • If using a 12z sounding add 2o • Start parcel at 50mb above the surface
Showalter Index (SI) • Compares a parcel starting at 850mb with the environment at 500mb. SI = (Tenv-Tparcel)500
Supercell Index • Weights various parameters which are indicative of possible supercell development
Important Points to Remember • Severe weather is more dependent on dynamical forcing than instability! • No one parameter tells the full tale! • 12z soundings usually predict afternoon convection better than 00z soundings predict evening convection.
Links • http://www.geocities.com/weatherguyry/swx2.html • http://avc.comm.nsdlib.org/cgi-bin/wiki.pl?Severe_Weather_Indices • http://www.theweatherprediction.com/severe/indices/ • http://www.theweatherprediction.com/habyhints/315/ • http://www.spc.noaa.gov/exper/mesoanalysis/ • http://mocha.meteor.wisc.edu/table.12z.html