Download

1 / 30
300 likes | 446 Views
Measuring the effectiveness of what we do … Growth and Effect Size: A new view Quality, Improvement and Effectiveness Unit,. Today we are hoping to: Increase your range of strategies, knowledge/skills and tools in measuring the effectiveness of our programs, processes and pedagogy.

E N D
Measuring the effectiveness of what we do … Growth and Effect Size: A new view Quality, Improvement and Effectiveness Unit,
Today we are hoping to: • Increase your range of strategies, knowledge/skills and tools in measuring the effectiveness of our programs, processes and pedagogy. • Engage in professional conversations with colleagues about measuring effectiveness
Socratic Thinking Activity:1. Locate your ‘paragraph’ group (2 mins)2. Share your thoughts (2 mins each: 10 mins)3. Summarise (5 mins)4. Reconnect (if time available)5. Learning Walk (if time available)
“My search is driven by the goal of ascertaining the attributes of excellence – because if we can discover the location of the goal posts … we can then have the basis for developing appropriate professional development and teacher education programs to highlight that which truly makes a difference.”(Hattie, 2003)
Terms to know about … • Raw Scores/Scale Scores • Standardised Scores • Vertical Scale • Standard Deviation • Confidence Interval • Standard/Benchmark • Growth • Gain • Progress • & Others … 1) Achievement levels 2) Growth What are the different kinds of ways we measure our improvement and effectiveness? Source: http://www.centerforpubliceducation.org/Main-Menu/Policies/Measuring-student-growth-At-a-glance 3) Value-Added 4) Multiple Measures 5) Statistical Methods, incl. Effect Size
Demonstrating effectiveness through … Achievement levelsAchievement levels:Established levels or categories of performance that describe how well students have mastered the knowledge and skills being assessedSource: http://www.centerforpubliceducation.org/Main-Menu/Policies/Measuring-student-growth-At-a-glance
Demonstrating effectiveness… Achievement levels Demonstrating effectiveness… Achievement levels, Exhibit 2
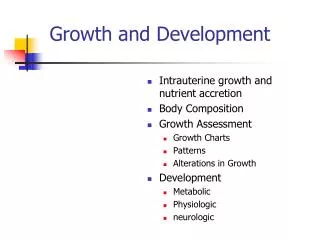
Demonstrating effectiveness… GrowthGrowth:Measures the amount of change (or difference) in performance or outcomes between two points in time.
Year 2 (2011) 25 Year 1 (2010) 20 U – highest 25% M – middle 50% 13 L – lowest 25% 2010 scaled score/level (all students starting on same scale score) Demonstrating effectiveness… Growth
Above expected performance Demonstrating effectiveness… Value Added Source: http://www.eduweb.vic.gov.au/edulibrary/public/commrel/policy/Blueprint2008/Blueprint_Measuring.pdf Below expected performance Within expected performance
Demonstrating effectiveness… Multiple MeasuresSource: http://www.decd.sa.gov.au/quality/files/links/FullGuideToSelfReview.pdf “Comparing results on different measures gives teachers insights into what teaching strategies, as well as testing strategies, work best with different students.” (Bernhardt, 2004).
Demonstrating effectiveness… Social Research MethodsSource: http://www.socialresearchmethods.net/kb/stat_t.php Students enrolled for >2 yrs at school perform on average higher in 4/5 aspects
Effect size is a simple measure for quantifying the difference between two groups on a common scale. What is effect size? “Effect size … allows us to move beyond the simplistic, “Does it work or not?” to the far more sophisticated, “How well does it work in a range of contexts?” (Coe, 2002)
What is making the difference in education as measured by Effect Size Source: http://www-958.ibm.com/software/data/cognos/manyeyes/visualize/skills-14/versions/1
Effect size is calculated by taking the difference between two mean scores and then dividing this figure by a standard deviation calculation** (i.e. average range of student scores). How do I calculate effect size? Effect Size (ES) = Difference between the two group mean scores Standard deviation** Research from Dr J. Hattie, average effect size across all students is ~0.4. It is recommended that most measures, including effect size are analysed within the context of their applicable assessment and cohort group**.
1) Checking the accuracy and validity to minimise misinterpretation 2) Asking about the achievement level AND growth better informs next steps
Mean score (or average) is calculated by adding all the individual student scores together and then dividing by the total number of student scores. • e.g. 2010 = 55.4+53.9+ …+11.8 = 39.6 How do I calculate effect size? 2) the difference between two mean scores e.g. 45.1 – 39.6 = 5.5 3) Standard deviation (sd), use a formula to calculate (i.e. basically the sum of the squared differences from the mean score). In MS Excel use the formula =stdev(), i.e. 12.7 and 10.9 4) Average (or pooled) standard deviation is the sum of the two standard deviations in step 3 above divided by 2 = (12.7 + 10.9) ÷ 2 = 11.8 Effect size is equal to the difference between the two mean scores (before/after) divided by the average standard deviation. i.e. divide the result in step 2) by the result in step 4) above: 5.4 ÷ 11.8 = 0.46
SA** comparative figure = 0.58 Analysing effect size – an example?
Multiple measures are still required • Caution for all small sample sizes and at the individual student level • Accuracy is enhanced when comparing the exact same group of students • NAPLAN effect sizes cannot be compared equally** What are the limitations of effect size and other growth measures/models?
Figure 1. Data Cycle4 • PREPARING (PLAN): Determine what data are required to diagnose and/or evaluate student learning (or priority area) • TAKING ACTION (ACT): Modify instruction to evaluate hypotheses and increase student learning • COLLECTING (DO): Prepare and collect the variety of data specified • ANALYSING (STUDY): Interpret data and develop hypotheses/implications about how to improve student learning Measures must reside in purposeful & ongoing cycles of improvement … ”Educational researchers have recently called for a more rigorous use of data in ways that promote an ongoing cycle of improvement … Using data within a cycle of improvement ensures that what gets collected is then analysed and used to enhance learning.” (Balacco, 2010).
Multiple measures are still required • Caution for all small sample sizes and at the individual student level • Accuracy is enhanced when comparing the exact same group of students • NAPLAN effect sizes cannot be compared equally** What are the limitations of effect size and other growth measures/models?
Clear purpose statement about the need for measuring and monitoring growth data and how it will be used • Properly designed, agreed to annual assessments – accuracy, consistency and coherence • Efficient systems for data management, analysis, presentation and timeliness of data • Available resources for capacity building – external, regional or site expertise, professional development opportunities, funding Next Steps forimplementing whole of region or whole of site based growth measures …
“Interpretation requires time, thoughtfulness, reservation of judgements and open challenge … it is formulating possibilities, developing convincing arguments, locating logical flaws and establishing a feasible and defensible notion of what the data represent” (Earl, 2006)
Summary1) current research and practical evaluation approaches using a range of growth measures/models2) Calculating, understanding and using effect size3) Feedback – Sticky note
Key References • Bernhardt, V., (2004). Data Analysis for Continuous School Improvement. Eye on Education, Larchmont, NY. • Coe, R., (2002). It’s the Effect Size, Stupid. What effect size is and why it is important presentation to the Annual Conference of the British Educational Research Association, England 2002. Retrieved November 2011 from http://www.leeds.ac.uk/educol/documents/00002182.htm • Hattie, J., & Masters, D., (2011). Visible Learning Plus. Supporting Material Visible Learning Workshop presentation in Adelaide, South Australia, 2011. • Quality, Improvement and Effectiveness Unit/Literacy Secretariat, (2012), What is effect size? Draft resource paper. • http://www.centerforpubliceducation.org/Main-Menu/Policies/Measuring-student-growth-At-a-glance • http://www.aasa.org/SchoolAdministratorArticle.aspx?id=7348 • www.tqsource.org/publications/MeasuringTeachersContributions.pdf